ISSN : 0975-3710
EISSN : 0975-9107

EL-NEMR M.K.1*
1Department of Agricultural Engineering, Faculty of Agriculture, Kafrelsheikh University, Egypt.
* Corresponding Author : moknemr@agr.kfs.edu.eg
Received : 08-03-2012 Accepted : 07-05-2012 Published : 07-05-2012
Volume : 4 Issue : 4 Pages : 216 - 220
Int J Agr Sci 4.4 (2012):216-220
DOI : http://dx.doi.org/10.9735/0975-3710.4.4.216-220
Conflict of Interest : None declared
It is very important to have a fast utility for the irrigation system evaluation to help the system designer and operator to evaluate the system performance and make the reactions towards any system operation problem if exists. Microsoft excel 2010 spreadsheet was successfully created in order to evaluate the drip irrigation system hydraulic performance. The spreadsheet was designed to provide the user with Friendly user interface, easy data input supported with input values check, giving more clarification for emitters’ flow distribution supported with charts, and Easy printable outputs Supported with user help work sheet. The uniformity parameters Included Uniformity coefficient, statistical uniformity, manufacturer’s coefficient of variation, emitters’ flow rate variation, distribution uniformity, and emission uniformity. Emitter exponent also can be calculated by this spreadsheet. The spreadsheet was evaluated by researchers involved with drip irrigation field as excellent rate, beside there was an agreement between spreadsheet calculations and evaluators’ in addition to saving the calculation time .
Drip, Evaluation, Irrigation, Spreadsheet, Uniformity
Drip irrigation system is widely spread as it can be used safely for most soil types; beside it has high theoretical application efficiency. The use of drip irrigation has been increase in most crop commodities, especially vegetable and fruit crops, to improve water use efficiency [1] and water supply [2] Nowadays how uniform is the distribution of water on land surface is accepted as one of the key criteria for evaluating irrigation system performance [3] Poor irrigation-water-application uniformity can be a cause of low crop-yields. Improved yields could result from maintaining the soil moisture at an optimum level through more frequent water and nutrient application [4] This can result from a uniform water application and effective scheduling. The uniform application of water will cause more uniform distribution of water in the root zone as the behavior of applied water affects the soil moisture pattern under point source trickle emitter [5] Final water application variability in drip system or any other irrigation system will depend on the manufacturing variation and the hydraulic variability [6] In order to conserve water resources, close attention has to be paid to the performance of irrigation systems [7] They added that, the regular irrigation system evaluation may assure how maintained is the system and how is its performing according to design. The irrigation system must also be managed correctly and effectively. The drip irrigation system offers the highest irrigation uniformity compared with other irrigation systems [8] Evaluation of drip irrigation system is important for several reasons .a- the design engineer in establishing whether the desired emitter discharge uniformity specification are being met , b- the irrigation in deciding whether the system can be operated efficiently , c- determining the proper operation of the system and its components to take remedial action as required [9] Several methods have been developed to aid in design of such a system [9] These include the Emission uniformity (EU) concept [10] Emitter flow variation concept [11] and statistical uniformity concept [12] A successful uniform drip irrigation system application depends on the physical and hydraulic characteristics of the drip tubing [13] Drip irrigation system efficiency depends on application uniformity. In surface drip irrigation systems, uniformity can be evaluated by direct measurements of emitter flow rates. In most cases, irrigation non-uniformity is the major source of reduced crop yields [1] 15]. It is very important to have a fast utility for the irrigation system uniformity evaluation to help the system designer and operator to evaluate the system performance and make the reactions towards any system operation problem if exists. Spreadsheets are easy, widely spread way to make needed fast calculations. One of the beauties of using spreadsheet is that it is possible to setup calculations, change some cell values and look at the effect on the result immediately [16] Microsoft Excel is used in solving optimization problems of one and several variables without constraints [17] Excel spreadsheet gives accurate calculations, easy user interface, and Compatible with most computer operating systems. This work introduces a Microsoft Excel spreadsheet that will calculate uniformity measures and emitter exponent to evaluate the drip irrigation system performance. There is numerous models capable of simulating crop behavior under water stress conditions but, none of them takes into consider the effect of irrigation water uniformity on yield [18] They developed a model to simulate the effect of uniformity on yield and the repercussion on growth margin. University of California introduced an Excel worksheet for the emission uniformity calculation and evaluation [19] [20] used spreadsheet as a simple conceptual model that the water losses in rice field has been developed and quantified in. [21] developed a simple design procedure for hydraulic analyses and uniformity evaluation and computer simulation model called Back Step Method to verify and evaluate the design procedure. This study indicated that emitter discharge is considered to be a spatial variable, which overcomes the uniform emitter discharge assumption used in the methods presented by [22] The spreadsheet was designed in order to give the following features:
Easy calculation for all uniformity parameters with friendly user interface.
Possibility for using wide range of emitters’ flow rates samples, in addition to the clarification for emitters’ flow distribution supported with charts.
Improve the spreadsheet user with values checking ability in order to notice any mistakes before applying his results.
Supported with user help beside easy printable outputs.
A spreadsheet was created using Microsoft Excel 2010 to evaluate the drip irrigation laterals performance under certain operating pressure head. The spreadsheet contains three worksheets. The first one called inputs and evaluation, on which the required input data, outputs and a chart for emitters’ flow rate distribution along lateral. The second one contains a chart to conclude the statistical relationship between emitter flow rate and operating pressure head. The third worksheet is a user guide help worksheet to explain how to use the spreadsheet step by step and clarifying the listed abbreviations and concepts which may face the user of the spreadsheet. Figure [Fig-1a] [Fig-1b] [Fig-1c] shows the three worksheets.
The required input data includes number of decided emitters’ samples, sampling time, number of emitters per emission point and the collected water samples’ volumes. The water samples’ volume should be put in ml. The spreadsheet deals with 16, 20, 24, and 28 sample of collected water. If the user reached the last cell he should use for his samples, he will be notified by a comment to stop. At the number of samples input cell, the user will be notified to choose a number from the previously mentioned compatible numbers of samples. If the user tried to input a different number instead of the mentioned numbers, he will be notified by a message that his input is wrong. The spreadsheet is designed to deal with number of emission point greater than zero otherwise the user will be notified to change this value. The sampling time should be entered in minutes or fractions of minutes. If the entered time value is less or equals zero, the cell will turn into red color and strikethrough to notify the user for the error. Depending on samples’ volume and sampling time, the flow rate for each emitter will be calculated in lh-1 unit and show the flow rates in descending way in dependent cells. [Fig-3] shows the input data worksheet.
The spreadsheet user will calculate and show the Uniformity coefficient, Manufacturers’ coefficient of variation. Distribution uniformity, emission uniformity, emitters’ flow rate variation, average emitters’ flow rate lh-1, descending flow rate distribution along lateral, and average of low quarter emitters’ flow rates. Theoretically the flow rate distribution along lateral is descending. A chart describing the flow rate distribution depending on the order of emitters’ flow rates along lateral which is put by the user compared to theoretical distribution (Flow rates reduces towards the end of lateral) will be shown to the user in order to help him if he has a problem in a certain emission point like partial clogging or landscape,..etc [Fig-1a]
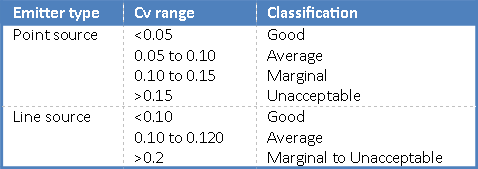
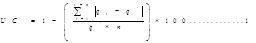
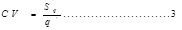
The uniformity parameters including Uniformity coefficient (UC), Statistical uniformity Us, Distribution uniformity (DU), Emission uniformity (EU), Manufacturing coefficient of variation (CV), and emitter flow rate variation (qvar) were used to evaluate the drip irrigation system performance. The degree of emitter flow variation is expressed by the uniformity coefficient as defined by the following equation [24] n = number of observed emitter or cans, qi = emitter flow rate, lh-1, q` = average of emitters flow rates, lh-1. Statistical uniformity was calculated using equation 2 [25] By using the statistical treatment, all of the various factors such as emitter manufacturing variation, lateral line friction, elevation difference, and emitter plugging are included [12] [Eq-2] emitter manufacturer’s coefficient of variation was calculated as follows [10] = standard deviation of emitters flow rate.
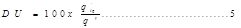
The emitter manufacturer’s coefficient of variation is a measure of the variability of discharge of a random sample of a given make, model and size of emitter, as produced by the manufacturer and before any field operation or aging has taken place [26] The emitters’ flow rate variation was calculated using the following equation [25] qmax= maximum emitter flow rate lh-1, and qmin= minimum emitter flow rate , lh-1. Distribution uniformity was calculated using the following equation [27] -  =mean of lowest one-fourth of emitter flow rates, lh-1.
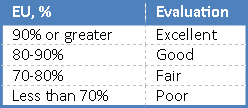
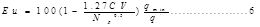
Emission uniformity expresses the uniformity of emitters under constant pressure [28] The emission uniformity in percent was calculated by the following formula [29] [Eq-6] the number of emitters per plant.
2.3 Flow rate- Pressure head relationship
Flow rate – pressure relationship was calculated by using equation [29] [Eq-7]
Where: -
h = operating pressure head in meters, x = emitter discharge exponent, and k = emitter discharge coefficient.
The emitter exponent shows how the emitter flow rate will be affected by pressure variation. The exponent of discharge (x) is affected by the type of emitter, the lower the value of x; the less the discharge will be affected by pressure variation. Emitter with exponent less than 0.5 is considered pressure compensating emitter. When x approaches 1 the emitter is considered laminar flow type or non-compensating emitter [30] Six operating pressure head and the facing values of emitters’ flow rates average will be put in a table in the input data worksheet. A chart describing the relationship between the logarithm of operating pressure head on the horizontal axis and the logarithm of emitter flow rate on the vertical axis will be shown on q-h relationship worksheet (Figure 1b). An exponential trend line will describe the relationship as shown in equation 7. The equation and R squared will be shown on the chart.
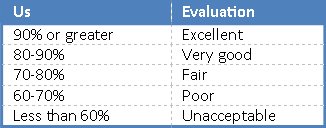
Us, EU, and CV were evaluated in order to evaluate the hydraulic performance of the system at certain operating pressure head. American Society of Agricultural Engineers [31] recommended a classification of manufacturer’s coefficient of variation. [Table-1] lists the recommendations for classifying the manufacturer’s coefficient of variation. The general criteria for EU values are shown in [Table-2] [32] The general criteria for an acceptable statistical uniformity coefficient are shown in [Table-3] [9]
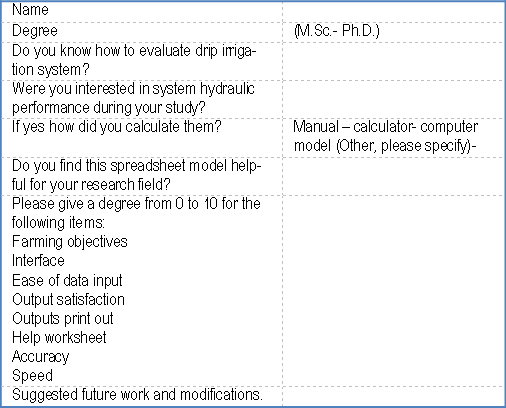
A questionnaire was prepared to ask possible interested users to evaluate the spreadsheet [Table-5] (Annex A). A Sample of 10 interested persons in drip irrigation study varied between master and Ph.D. degrees holders. This questionnaire also was designed to get a sight for the suggested future work. The spreadsheet purpose and use method was explained before applying the questionnaire. It was asked from the specialists to evaluate how helpful do they expect the spreadsheet will be for farmers and farming objectives. They were also requested to evaluate the interface, how easy is the data input, how are their satisfied to the outputs, outputs printout, and the help worksheet. They were asked to evaluate the previously mentioned indicators as spreadsheet features indicators with a value from 0 to 10. The average of each indicator was used to describe the final user opinion about each system feature indicator. A rate for each indicator values was put and explained to the sample persons to take into consider during evaluation. Table 4 shows the rate which is equivalent for each range of degrees. A case study of 20 water samples was given to the researchers to calculate the uniformity measures and compare the results they got with the spreadsheet results in order to evaluate the spreadsheet accuracy and calculation speed. The average of difference percentage between the spreadsheet and their calculations was used to evaluate the accuracy. They evaluation samples used the spreadsheet also in order to compare calculation time.
[Fig-3] shows the degree of each features indicators. The help worksheet had the highest degree (9.5) while checking values help had the lowest one (7.5). The questionnaire analysis showed that, the researcher found the spreadsheet Excellent for farming objects. The average of all indicators was 8.7 which will give excellent rate for this spreadsheet application. The calculation of the spreadsheet agreed with the calculations of the researchers. The uniformity parameters and evaluation took 82 minutes in average while the calculation with the spreadsheet took 3 minutes in average including printout.
This spreadsheet gave a useful utility to calculate and evaluate the drip irrigation system uniformity parameters. The evaluation of the spreadsheet showed that all the indicators used showed a rate between very good and excellent. The major advantages of using Excel spreadsheet like the possibility of calculations setup, changing cell values and watching the effect [16,17] was successfully used in this spreadsheet design and achievement. The University of California 2011 introduced a worksheet for emission uniformity calculation and evaluation [19] In this work the CV, EU, DU, UC, Us, and qvar were calculated in addition to the evaluation of EU, Us, and CV. The emitter exponent calculation and charts support were also provided. Help worksheet which had the highest degree is considered one of the main features of this spreadsheet. This spreadsheet may also help if combined with a crop productivity simulation model in order to put the effect of drip irrigation system uniformity parameters in consider as one of the most important factors affecting the crop yield although it is neglected in most simulation models [18] The checking values support of this spreadsheet should be improved as it had the lowest degree with using some advanced methods like macros which is supported by the Excel program in order to give the user higher possibility to check his values without making effect on calculations if wrong. The evaluators gave a rate excellent for the farming object which may mean it is useful to ensure the good performance of the drip irrigation system to avoid lack of crops [14,15] and to take reaction towards any design or operating problems if exists [9]
An interactive Microsoft excel 2010 spreadsheet was successfully created in order to evaluate the drip irrigation system hydraulic performance. The spreadsheet was designed to provide the user with Friendly user interface, easy data input supported with input values check, giving more clarification for emitters’ flow distribution supported with charts, and Easy printable outputs. The uniformity parameters Included Uniformity coefficient, statistical uniformity, manufacturer’s coefficient of variation, emitters’ flow rate variation, distribution uniformity, and emission uniformity. Emitter exponent also can be calculated by this spreadsheet. A user guide help sheet is also provided. The spreadsheet was evaluated by drip irrigation interested researchers in the drip irrigation field. It was observed that the checking values feature had the lowest degree which made a very good rate while the help spread sheet had the maximum degree with an excellent rate. The spreadsheet was evaluated in general as excellent. The spreadsheet calculations agreed with evaluators calculations and saved time of calculation time. There should be some improvements on checking values like the spreadsheet should stop calculations with wrong input values. A wider range of emitter samples is also required.
[1] Jayapiratha V., Thushyanthy M. and Sivakumar S. (2010) Asian journal of agricultural research 4(3), 139-147.
» CrossRef » Google Scholar » PubMed » DOAJ » CAS » Scopus
[2] Shiri-e-Janagrad M., Tobeh A., Hokmalipour S., Jamaati-e-Somarin S., Abbasi A. and Shahbazi K. (2009) Asian journal of plant sciences 8(6),390-399.
» CrossRef » Google Scholar » PubMed » DOAJ » CAS » Scopus
[3] Yavuz M.Y., Demırel K., Erken O., Bahar E. and Devecıler M. (2010) Afr. J. Agric. Res., 5: 532-538.
» CrossRef » Google Scholar » PubMed » DOAJ » CAS » Scopus
[4] Phene C.J. (1991) Southern African Irrigation Symposium, 34-41.
» CrossRef » Google Scholar » PubMed » DOAJ » CAS » Scopus
[5] Ainechee G., Boromand-Nasb S. and Behazd M. (2009) Journal of applied science 9(6), 1170-1174.
» CrossRef » Google Scholar » PubMed » DOAJ » CAS » Scopus
[6] Gil M., Rodriguez-Sinobas L., Juana L., Sanchez R. and Losada A. (2008) Irrig. Sci., 26, 451-458.
» CrossRef » Google Scholar » PubMed » DOAJ » CAS » Scopus
[7] Ascough G.W. and Kiker G.A. (2002) Water SA, 28: 235-242.
» CrossRef » Google Scholar » PubMed » DOAJ » CAS » Scopus
[8] Kirnak H., Dogan E., Demir S. and Yalcin S. (2004) Turk. J. Agric. For., 28, 223-230.
» CrossRef » Google Scholar » PubMed » DOAJ » CAS » Scopus
[9] Bralts V.F. (1986) Operational Principles. In: Trickle Irrigation for Crop Production Design: Operation and Management, 216-240.
» CrossRef » Google Scholar » PubMed » DOAJ » CAS » Scopus
[10] Keller J. and Karmeli D. (1974) Trans. ASABE., 17(4), 678-684.
» CrossRef » Google Scholar » PubMed » DOAJ » CAS » Scopus
[11] Wu I.P. and Gitlin H.M. (1974) Hawaii Agricultural Experiment Station Technical Bulletin, 96, University of Hawaii, 29.
» CrossRef » Google Scholar » PubMed » DOAJ » CAS » Scopus
[12] Bralts V.F., Wu I.P. and Gitlin H.M. (1981) Amer. Soc. Agric. Eng. 24(5),1234-1240.
» CrossRef » Google Scholar » PubMed » DOAJ » CAS » Scopus
[13] Al-Amound A.I. (1995) J. Agric. Eng. Res., 60: 1-5.
» CrossRef » Google Scholar » PubMed » DOAJ » CAS » Scopus
[14] Wu I.P. (1987) Agric. Water Manage., 32: 275–284.
» CrossRef » Google Scholar » PubMed » DOAJ » CAS » Scopus
[15] Bhatnagar P. and Srivastava R. (2003) Irrig. Sci., 21: 151-157.
» CrossRef » Google Scholar » PubMed » DOAJ » CAS » Scopus
[16] Peker M. and Halat E. (2009) Journal of applied science. 9(7),1301-1308.
» CrossRef » Google Scholar » PubMed » DOAJ » CAS » Scopus
[17] Radwan F.A.A. (2002) Journal of applied science. 2(1), 92-96.
» CrossRef » Google Scholar » PubMed » DOAJ » CAS » Scopus
[18] Lopez-Mata E., Tarjuelo J.M., de Juan J.A., Ballesteros R. and Dominguez A. (2010) Agric. Water Manage., 98: 190-198.
» CrossRef » Google Scholar » PubMed » DOAJ » CAS » Scopus
[19] UCCE (2011) http://cesonoma.ucdavis.edu/.
» CrossRef » Google Scholar » PubMed » DOAJ » CAS » Scopus
[20] Islam M.J., Mowla G., Islam M.S. and Leeds-Harrison P.B. (2003) Pak. journal of biological science 6(18), 1600-1607.
» CrossRef » Google Scholar » PubMed » DOAJ » CAS » Scopus
[21] Sharaf G.A. (2004) J. Agric. Eng., 21: 103-124.
» CrossRef » Google Scholar » PubMed » DOAJ » CAS » Scopus
[22] Keller J. and Bliesner R.D. (1990) Sprinkler and Trickle irrigation. Van Nostrant Reinhold, New York.
» CrossRef » Google Scholar » PubMed » DOAJ » CAS » Scopus
[23] Wu I.P. and Gitlin H.M. (1975) J. Irrig. Drainage Div., 101: 323-326.
» CrossRef » Google Scholar » PubMed » DOAJ » CAS » Scopus
[24] Christiansen J.E. (1942) Trans. Am. Soc. Civ. Eng., 107: 221-239.
» CrossRef » Google Scholar » PubMed » DOAJ » CAS » Scopus
[25] Bralts V.F. and Kesner C.D. (1983) Drip irrigation field uniformity estimation. Trans. ASABE, 26: 1369-1374.
» CrossRef » Google Scholar » PubMed » DOAJ » CAS » Scopus
[26] ASAE (1996) American Society of Agricultural Engineer, 864.
» CrossRef » Google Scholar » PubMed » DOAJ » CAS » Scopus
[27] Kruse E.G. (1978) J. Irrig. Drainage Div., 104, 35-41.
» CrossRef » Google Scholar » PubMed » DOAJ » CAS » Scopus
[28] ASAE. (1994) American Society of Agricultural Engineers., 724-727.
» CrossRef » Google Scholar » PubMed » DOAJ » CAS » Scopus
[29] Keller J. and Karmeli D. (1975) Rain Bird Sprinkler Manufacturing Corporation, 133.
» CrossRef » Google Scholar » PubMed » DOAJ » CAS » Scopus
[30] James L.G. (1988) Principles of farm irrigation system design, John willey & sons, inc.
» CrossRef » Google Scholar » PubMed » DOAJ » CAS » Scopus
[31] ASAE (1985) American Society of Agricultural Engineers.
» CrossRef » Google Scholar » PubMed » DOAJ » CAS » Scopus
[32] Merriam J.L. and Keller J. (1978) Farm Irrigation System Evaluation: A Guide for Management., 271.
» CrossRef » Google Scholar » PubMed » DOAJ » CAS » Scopus
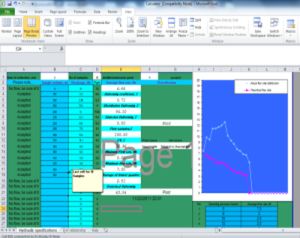 | Fig-1a-Worksheets used in the evaluation spreadsheet- a- Input data and uniformity parameters calculation worksheet |
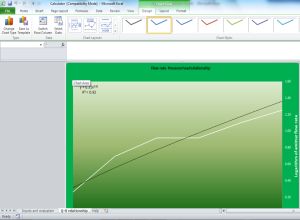 | Fig-1b-Worksheets used in the evaluation spreadsheet-b-Flow rate-pressure head diagram |
 | Fig-1c- Worksheets used in the evaluation spreadsheet- c- Help worksheet |
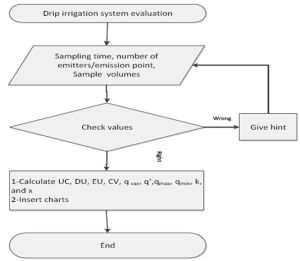 | Fig-2- Data flow chart |
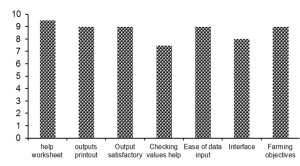 | Fig-3- Spreadsheet evaluation indicators comparison |
 | Table-1- Classification of CV values range |
 | Table-2- General criteria for EU |
 | Table-3- Values of statistical uniformity and its evaluation |
 | Table-4- Rates equivalent to evaluation indicators degrees in users questionnaire |
 | Table-5- Spreadsheet evaluation questionnaire |
 | Eq-1 |
 | Eq-2 |
 | Eq-3 |
 | Eq-4 |
 | Eq-5 |
 | Eq-6 |
 | Eq-7 |