ISSN : 0975-3710
EISSN : 0975-9107

VLAD BRUMFELD1*, DAVID E. GERRARD2
1Electron Microscopy Unit, The Weizmann Institute of Science Rehovot, ISRAEL
2Department of Animal & Poultry Sciences Virginia Tech USA
* Corresponding Author : Vlad.Brumfeld@weizmann.ac.il
Received : 21-11-2011 Accepted : 12-12-2011 Published : 15-12-2011
Volume : 3 Issue : 3 Pages : 140 - 144
Int J Agr Sci 3.3 (2011):140-144
DOI : http://dx.doi.org/10.9735/0975-3710.3.3.140-144
Conflict of Interest : None declared
High resolution 3D x-ray tomographic imaging is a powerful technology that allows for studying underlying tissue structures. We report herein that fresh and cooked beef and poultry meat examined by three dimensional X-ray tomography reveal textural characteristics that may be involved in determining meat tenderness. Samples of poultry breast meat contained fiber-like structures that were less organized than those visible in images of samples taken from the leg meat. Likewise, samples from muscles collected from chuck-, ribeye- and tenderloin-derived steaks possessed fibers organized with increasing randomness, respectfully. These data together show that three-dimensional x-ray tomography is capable of discerning the structural organization of connective tissue fibers in meat that may play a role in determining meat tenderness in both raw and cooked meat.
muscle structure, X-ray tomography, texture, tenderness.
Meat is highly filamentous in nature and consists of muscle fibers constructed of actin and myosin filaments that facilitate muscle contraction [1] . The relative size of muscle fibers increases with animal age and varies with meat cut and the underlying muscle present in the cut [2,3,3] . After the culmination of biochemical and physical events involved in the transformation of muscle to meat [4] , muscle tissue becomes rigid from the onset of rigor. This well-defined interaction between sarcomeric proteins is a major contributor to a loss in tenderness but is quite susceptible to proteolysis postmortem [5] . Though muscle consists largely of those proteins directly involved in contraction, individual muscle fibers and bundles of fibers are surrounded by fibrous connective tissue mainly composed of collagen fibers and elastin [1] . The amount and type of collagen, mainly of type I and III, depends largely on the degree of activity of each muscle and animal age [6,7] . This connective tissue aspect of meat, along with protein hardening, is critical to meat tenderness development [8] . The aforementioned suggest that meat texture and subsequently tenderness could be partly explained or predicted if the complex structure of the connective tissue fibers could somehow be visualized and evaluated. Several works have attempted to evaluate muscle structure,structure; however, these attempts were targeted to resolving the intricacies associated with muscle contraction rather than attempting to visualize the underlying connective tissue structure of the meat. This scarcity of information regarding the structures responsible for controlling meat tenderness [9-11] is largely because there are no adequate experimental methods to address this complex, three-dimensional structure. Unfortunately, this has led to the notion that the spatial structure of connective tissue fibers may be of little importance in meat tenderness or that it is destroyed during the cooking process (see [10] ).
Meat cookery methods reduce the inherent toughness of meat, some being more effective than others, and some very cut-specific [12] . With the exception of the development of variations in carcass suspension, which is designed to lengthen sarcomeres pre-rigor [13] , the reduction of toughness induced by rigor and the underlying connective tissue structures is primarily achieved by cookery methods. This process, in particular, alters the collagen matrix either by “melting†it into gelatin or by completely destroying it through high moisture cooking. To our knowledge, there are no data about the three-dimensional structure of meat following different cooking methods. Data presented here report on studies using tomographic images obtained by x-ray micro-CT of meat samples that address the underlying three dimensional structure of muscle in raw and cooked meat. These are the first data to show the use of micro CT in resolving meat structure and discuss the possible implications of the tissue structure in affecting background toughness in meat.
Approximately 5 x 5 x 1 cm pieces of fresh chicken breast and beef tenderloin, rib eye steak and chuck steak samples were prepared from meat purchased from a retail market. Age postmortem or individual animal source was not known. Samples were held at 4 C until pan grilling 2 min per side under high flame to an internal temperature of 650C. Additional samples were subjected to microwave heating for 1.5 min at 750W. Other samples were dried in a critical point drier (Bal-Tec CPD 030, Balzers, Liechtenshtein). Raw samples were refrigerated at 4 C for 18 h. Samples intended for comparison were prepared together. In an attempt to eliminate possible animal to animal variation, additional breast and leg samples (3 x 3 x 3 cm) were obtained from the carcass of a 1 yr-old hen and prepared either by refrigeration at 4 C for 18 hr or by heating at 100 C for 15 min. After sample preparation, a 5 mm long slice parallel to the meat fibers and measuring 1.5 x1.5 mm was isolated from the center of each sample and vertically immobilized by applying a slight pressure into a standard 0.2 ml empty pipette tip. For critical point dried samples, a random piece of sample was analyzed. The pipette and tip containing samples were examined in a micro CT instrument (Mxct 400, XRadia, USA) under 40KV and 200 A. Unless stated otherwise, 1500 projection images with 5 sec exposure time and 10X magnification were recorded. No x-ray source filter was used. Results were obtained with a pixel size of 1.13 m, unless stated otherwise. All two-dimensional images included representative sections through the reconstructed volume after tomography. All experiments were repeated at least three times. Image analysis was performed using the Avizo (VSG International ltd) software package (see also [14] ).
Following partial drying of meat, fibers became X-ray visible. Even the mildest of preparations, such as refrigerating overnight allows for observation of the spatial properties of fibers associated with the sample. [Fig-1] shows the two-dimensional structure of muscle taken from raw chicken breast meat and that taken from a beef chuck steak. The random architecture of the fibers in the chicken meat, as opposed to the parallel fibers in the beef is clearly shown. Although the image does not have the contrast to reveal individual fibers, their overall spatial arrangement is quite evident. The difference in the orientation of the fibers is probably the result of less collagen in the chicken than in the beef or is a function of muscle type, which differs greatly between these two meat samples [15] . Regardless, different tissue architectures exist between these two distinctly different muscles and may partially explain differences in texture and tenderness between chick breast meat and beef. Supplementary movie 1 convincingly illustrates this result.
Species-specific arrangement is maintained after cooking
The difference in the underlying structure is maintained even after cooking, regardless of the cookery method used. [Fig-2] shows two samples from the same piece of meat after either 4 min of grilling or 1.5 min of microwaving. These data show the more organized structural matrix of fibers in beef (Figure 2C) versus the random nature of the structural elements in chicken breast meat (Figure 2A) even though some fibers may have been affected by Maillard reaction and appear brighter. Microwaving induced a drier state of the samples and allowed visualization of individual fibers in the beef sample (Figure 2D). In beef, fibers appeared almost parallel to each other while in chicken breast meat fibers were only slightly domain-oriented (Figure 2B). Even the slower industrial meat processing techniques which leads to chicken pastrami (see Figure 2E), revealed the unordered structure similar to our chicken meat samples.
To support the claim that the differences between the two meats is related to inherent differences in the underlying structure of the connective tissues rather than from preparation artifacts, pieces of meat were dried. [Fig-3] shows the fibers in chicken are randomly organized (Figure 3A), whereas those of beef, are highly organized (Figure 3B).
Fiber arrangements segregate with cuts inherently different in tenderness ratings
To investigate the potential of micro CT to discern between cuts of beef differing in inherent tenderness ratings, samples from tenderloin, ribeye and chuck steaks were collected, cooked and subjected to micro CT. [Fig-4] shows representative images of the three cuts. Figure 4A and B show the underlying structure in the tenderloin as being mostly irregular, more easily visible in the microwave-cooked sample (Figure 4B) than in the grilled sample (Figure 4A). Samples from the ribeye appeared more organized, with fibers following mostly two preferential directions (see arrows). Again, the microwave-cooked sample (Figure 4D) is more organized than the grilled sample (Figure 4C). Finally, samples from the chuck steak consisted of fibers that are highly organized, being grouped into larger structures that are clearly parallel to each other. This order is, again, clearer in the microwave sample (fig 4F). [Fig-5] shows samples from the breast and leg of the same chicken. In order to increase the field of view, we reduced the magnification to 4x and increased the number of projections to 2500. As a result, the pixel size in [Fig-5] is 5.08 µm. As expected, the fibers in muscle samples taken from the leg appeared well-organized (Figure 5D) while those observed in the breast meat were clearly random (Figure 5A). After heating, much of the structure was lost, though that from the leg retained more order (Figure 5E). Figure 5C and F are the corresponding skeletonized versions of FigureFig 5A and D, respectively. Skeletonizing removes all information in an image but retains the general orientation of the structures. To that end, the parallel orientation of the fibers in the center of the image of the leg sample are clearly evident (Figure 5F), while the fibers in the breast are random in nature (Figure 5C). Detailed image analysis of the central areas of the figure, quantitatively confirms this result. The degree of asymmetry in the breast sample is 0.24 while that in the leg it is only 0.057, which points to the fact that fibers in the breast sample are less oriented than in the leg. Also, the fractal dimension is 1.57 in the breast and only 1.34 in the leg sample, which means that decomposition of images in simple shapes like straight lines and points is more complex in the breast than in the leg. Supplementary movies 2 and 3 show a three-dimensional rendering of the samples. Since the differences between the samples are a 3D effect, the movies illustrate this aspect more clearly and more convincingly than the 2D pictures.
Tenderness is a complex quality characteristic of meat and depends on number of structural features related to inherent tissue components including the type and quantity of the collagen fibers. This paper shows that micro CT is capable of detecting differences in the three-dimensional structure of different meat cuts prepared differently. These structural differences segregate with classically perceived tenderness ratings, showing that micro CT is useful in predicting meat tenderness in intact fresh or cooked meat products based on underlying connective tissue structure. Additional work is needed to understand exactly what structures are important in defining meat tenderness with micro CT scanning.
[1] Hertzman, C., Olsson, U, & Tornberg, E. (1993), Principles of meat science, 3rd ed., Kendall/Hunt Publishing Company, Dubuque, Iowa.
» CrossRef » Google Scholar » PubMed » DOAJ » CAS » Scopus
[2] Hammond J. (1932), Growth and the development of mutton qualities in sheep, Oliver and Boyd London.
» CrossRef » Google Scholar » PubMed » DOAJ » CAS » Scopus
[3] Hiner, R.L, Hanxins, O.G, Sloane, H.S, Fellers G.R., & Anderson E.E. (1953), Food Res. 18, 363.
» CrossRef » Google Scholar » PubMed » DOAJ » CAS » Scopus
[4] Scheffler T. L., Park, S., & Gerrard D. E. (2011) Meat Science 89, 244-250.
» CrossRef » Google Scholar » PubMed » DOAJ » CAS » Scopus
[5] Huff-Lonergan, E., Z. Wang Z. and S. E. Lonergan S. E. (2010), Meat Science, 86(1): 184-195.
» CrossRef » Google Scholar » PubMed » DOAJ » CAS » Scopus
[6] Bailey, A.J., & Light, N.D. (1989), Connective Tissue in meat and meat products. Elsevier, London-New York, 1-355.
» CrossRef » Google Scholar » PubMed » DOAJ » CAS » Scopus
[7] Bendall, J.R. (1967), J. Sci. Food and Agriculture 18, 553-558.
» CrossRef » Google Scholar » PubMed » DOAJ » CAS » Scopus
[8] Christensen, M., P.P. Purslow P.P. & Larsen, L.M. (2000) Meat Science, 55 (3), 301-307.
» CrossRef » Google Scholar » PubMed » DOAJ » CAS » Scopus
[9] Nishimura, T. (2010), Animal Science Journal 81, 21–27.
» CrossRef » Google Scholar » PubMed » DOAJ » CAS » Scopus
[10] Lepetit, J. (2008), Meat Science 80, 960-967.
» CrossRef » Google Scholar » PubMed » DOAJ » CAS » Scopus
[11] Jones S.B., Carroll R.J, & Cavanaugh J.R. (1977), J. Food Sci. 42, 125-131.
» CrossRef » Google Scholar » PubMed » DOAJ » CAS » Scopus
[12] Tornberg, E. (2005) Meat Science, 70 (3), 493-508.
» CrossRef » Google Scholar » PubMed » DOAJ » CAS » Scopus
[13] Herring H.K., Cassens R. G., & Briskey E. J. (1965), J. Food Sci 30 1049-1054.
» CrossRef » Google Scholar » PubMed » DOAJ » CAS » Scopus
[14] Russ, J.C,. (2002), The image processing handbook, CRC Press.
» CrossRef » Google Scholar » PubMed » DOAJ » CAS » Scopus
[15] Lefaucheur, L. (2010) Meat Science, 84(2), 257-270.
» CrossRef » Google Scholar » PubMed » DOAJ » CAS » Scopus
 | Fig. 1- Three-dimensional structure of representative samples from raw meat from chicken breast (A) and chuck steak (B). Vertical bar is 150 m. Horizontal bar is 100 m. Boxes identify magnified field of interest. |
 | Fig. 2- Tomographs of grilled (top row) and microwaved (bottom row) chicken (left column) and beef (right column) samples. The center image (E) shows a tomogram of a piece of processed chicken pastrami. For A to D, vertical bar is 150 m, horizontal bar equals 100 m. For E, vertical bar equals 100 m, horizontal bar is 275 m. Boxes identify magnified field of interest. |
 | Fig. 3- Tomograms of critical point dried pieces of chicken breast (A) and beef chuck steak (B) samples. Scale bars are 150 m. |
 | Fig. 4- Comparison of the three dimensional architecture of samples from grilled and microwave-cooked tenderloin (A) and (B), ribeye steaks (C) and (D) and chuck steaks (E) and (F), respectively. Scale bars are 120 m. Boxes identify magnified field of interest. |
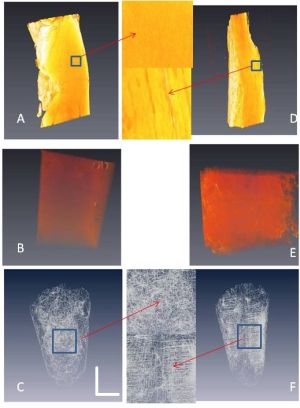 | Fig. 5- Three-dimensional structure of raw (A and D) and cooked (B and E) breast (left column) and leg (right column) meat samples. Skeletonized images (bottom row) of breast and leg samples (C and F, respectively). Scale bars are 1 mm. Boxes identify magnified field of interest |