ISSN : 0975-3710
EISSN : 0975-9107

TODKARI G.U.1*, BARAKADE A.J.2, LOKHANDE T.N.3
1Department of Geography, Shri. Sant Damaji Mahavidyalaya, Mangalwedha, MS, India
2Department of Geography, Karmaveer Bhaurao Patil Maahidyalaya, Pandharpur, MS, India
3Department of Geography, Karmaveer Bhaurao Patil Maahidyalaya, Pandharpur, MS, India
* Corresponding Author : govind.todkari@gmail.com
Received : 26-07-2011 Accepted : 15-09-2011 Published : 15-12-2011
Volume : 3 Issue : 3 Pages : 110 - 117
Int J Agr Sci 3.3 (2011):110-117
DOI : http://dx.doi.org/10.9735/0975-3710.3.3.110-117
Conflict of Interest : None declared
The present study is carried out into March-April 2010 determine the economic of onion cultivation, price spread, marketing channels and marketing efficiency of onion in Satara district. Satara district is leading in onion production it covers 12.38 per cent of total in the State. A study was conducted in western part of the Satara district. A sample of 180 onion growers was selected randomly from 20 villages in ten tahsils of Satara district of Maharashtra State. Onion cultivation is concentrated in the eastern part of the Satara district. The selected cultivator were classified into three categories i.e. small (below 2 ha.), medium (2-4 ha.) and large (above 4 ha.) based on land holding size of the farmers. The primary data were collected by survey method with the help of pre-tested schedule of questionnaire through personal interview. In view of this, an attempt in this study is made to study profitability and resource productivity in onion production in Satara district.
Economics, Cost, Cultivation, Production, Efficiency, Marketing.
Onion is one of the most popular vegetable that form of daily diet. In India, onion an important commercial crop. It is widely grown is different parts of the country. At present, India stands second larger producer of onion in the world, next only to China (FAO, Production Year Book). Indian onions are famous for their pungency and are available round the year. At least 175 countries grow onions. According to the United Nations Food and Agricultural Organizations. There are estimated 6.7 million acres of onion is an indispensable item in every kitchen as condiment and vegetable. It is used either in raw form and dehydrated form to add favor and taste to Indian cousins. Since onion has medicinal value, it is used in some pharmaceutical preparation also. It has many uses as, folk remedies and recent report suggests that onion play a part in preventing heart diseases and other ailments. Onion bulb is rich in minerals like phosphorous, calcium and carbohydrate. It also contains proteins and vitamin C.
China ranks first in area and second in onion production in the world. The area under onion in India was 804.600 thousands ha. and its production was 82 lack MT in 2010-11. It is grown in three seasons of the year (i) Kharif, (ii) late Kharif and (iii) rabbi. The major onion production are Maharashtra, Gujarath, Uttar Pradesh, Rajasthan, Orissa, Karnataka, Tamil Nadu, Madhya Pradesh and Bihar. Maharashtra ranks first in onion production with a share of (18%) in terms of productivity. The principal onion growing districts in the Maharashtra State are Satara, Nashik, Jalgaon, Pune, Solapur and Ahmednagar occupying about 94.68 per cent of area under cultivation of onion in the State. Particularly in eastern part of the Satara district of the State Kharif and rabbi onion is highest grown by cultivators in certain pocket only.
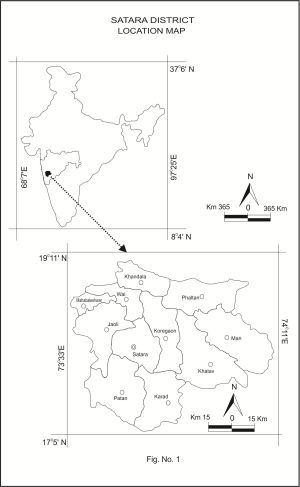
The Satara district is situated in west part in Maharashtra State. This district consists eleven tahsils covering 1739 villages. The total area extend is of 10,480 sq. km. extending from 170 5’ to 180 11’ north latitudes and 730 33’ to 740 54’ east longitudes. The climate ranges from the rainiest in the Mahabaleshwar region which has an average annual rainfall of over 6000 mm. to the driest in Man, Phaltan, Khandala and Khatav tahsils where the average annual rainfall is about 500 mm. [Fig-1] .
The present study was undertaken with the following objectives.
1. To study the economics of production of onion.
2. To study the marketing pattern and price spread in the marketing of onion.
The study was conducted in Satara district of Maharashtra. The selection of district and tahsils was based on certain criteria. Stratified random sampling procedure was adopted for the selection of villages and onion cultivation. A sample of 20 villages was selected for the study of onion cultivation. Further, it was decided to select a sample of 180 onion respondents from these selected onion growing villages. A list of all the onion producing farmers from each selected villages was prepared and classified in three groups i.e. small (below 2 ha.), medium (2-4 ha.) and (above 4 ha.) based on land holding size of the farmers. The primary data were collected by survey method with the help of pretested schedule of questionnaire through personal interview. The required primary data pertaining to cost, yield, prices and expenditure for the year 2010-11 were collected from selected onion growers.
Cost of production means the expenses incurred per unit of output. The items of cost that go into the cost of production are both fixed cost remains fixed in the short run, it is in the variable cost or operation cost that the farmers have some scope to make economy.
Kumbhar (2000) studied economic of production and marketing of rabbi onion in Pune district. The major items cost of cultivation were seeds, hired human labour, manures, bullock charges, fertilizer and rental value of land. Mohaptra and Romeo (2007) studied that the average per hectare cost of cultivation of onion in Bolangir district of Orissa. Shah (1999) conducted was study on an economic evaluation of onion production and its marketing in Maharashtra. The analysis of cost structure revealed that total cost of onion production was found much higher in rabbi season compared to that during Kharif season. This find true for all categories of onion producers.
Market price of input that were prevailing at the time of their use were considered for working out of cost of cultivation. The gross return was calculated on the basis of market price of the produce at the time when the produce is ready for sale. Net returns Rs. ha. was calculated by deducting the cost of cultivation from the gross income.
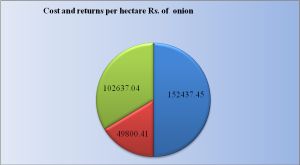
It is seen from [Table-1] and [Fig-2] and [Fig-3] shows that at the overall level in Satara district Man, Phaltan, Khandala, Khatav, Koregaon, Wai, Satara, Patan, Jaoli, and Karad tahsils the per hectare cost of cultivation of onion. It is evident percentage share of the total variable cost is Rs. 93500.19 (i.e. 91.09%) and fixed cost of production is Rs.9136.85 (i.e.8.90%) to total cost of production.
Land preparation(3.09%), seeds (6.15%), nursery raising (1.13%), manures(7.30%), fertilizers(7.42%), pesticides(5.65%), irrigation (4.77%), transplanting (5.06%), weeding and hoeing (3.84%), harvesting and curing (6.67%), repair and maintained (1.71%), interest on variable cost (3.75%) and transportation and marketing cost (34.49%) cost of total production. Among the different items of cost, the rental value of land, bullock charges, machine charges, total hired human labor charges, seeds, manures, fertilizers, plant protection and irrigation cost were the major items of cost of cultivation in all small, medium and large farmers.
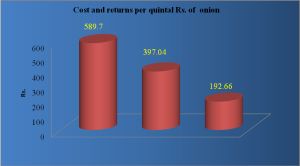
The average net returns obtained by onion growers amounted to Rs.49800.41 per hectare with gross returns of Rs. 152437.45 per hectare. The average yield per hectare onion production 258.50 quintal. The comes cost of production onion per quintal Rs.397.04 and net profit per quintal Rs.192.66. The Cost Benefit Ratio comes to about 1:1.48. It is definitely an encouraging return to the farmers only four to five months.
The farmers in groups were asked to estimate the cost depending on their practices and experiences and their net profits based on the price they generally received. Being are of farm profitability from practices, time and location of production and marketing and supply and demand situation in market. These finding are in conformity with the finding of Jat and Jain (2008) and Nikam (2008).
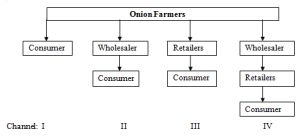
For the marketing of onion the important channel were identified (1) Producers-consumer(2) producer-howcker-shopkeeper-consumer (3) producer-wholesaler-retailer-consumer.
It was observed [Table-2] data presented reveals that producers share in consumers rupee 78.68 percent by selling fresh onion. The wholesalers and retailers are taking away the major share of 5.37 percent and 8.76 percent of consumers price without investing any penny in the marketing process. The onion growers did not have any control over the market due to the absence of coordination and integration among themselves. All the expenses in the marketing process are incurred by the producers practically the retailers or buyer charges paid to mandi are also charged from the producer.
Marketing channels indicate how various market participants are organized to accomplish the movement of a product from producer to the final consumer. They are classified according to channel levels and the number of channel levels differs by product and by rural and urban location. The distribution channels for onion in the study area are shown in [Fig-4] . [Table-3] presents shows that the maximum quantity of onion was passed through channel IV, 75.90 per cent followed by channel II, 21.30 per cent, channel III, 12.98 per cent and channel I, 2.88 per cent. The onion growers were observer to use different channels viz. producers-consumers, Producers-wholesalers-consumers and producer-wholesaler-retailer-consumer respectively.
The price spread refers to the difference between the price paid by the consumer and the price received by the producer for an equivalent quantity of farm produce. This spread consists of marketing costs and margins of the intermediaries, which ultimately determine the overall effectiveness of a marketing system. The price spread will be helpful in studying the efficiency of the marketing system [Table-4] .
The cost of onion production was calculated at Rs.397.04 per quintal which includes land inputs, labour inputs and capital inputs for example land preparation, raising of nursery, transplanting, weeding, fertilizer, pesticides and application of picking. The total marketing cost for all stages was higher in the wholesale channel, which amounted to channel IV Rs. 188.45 quintal compared to Rs.47.00 quintal in channel I. It was due to high cost incurred by the farmers in the channel IV accounted for 19.48 per cent of the total marketing costs. The cost and margin for each agency in various channels was estimated and their share in different channels is given in Table.4. Shaymsundar (1946) studied the marketing margins and price spread onion in Kolar district. Thakur (1971) conducted a study to asses the marketing supply and prices of onion in Ludhiana and Panipat markets of Punjab and Haryana. Subranmanyam (1996) studied post harvest losses in horticultural crop in India.
The producer share in consumers rupee was the highest (93.06%) in channel I and the lowest (68.82%) in channel IV. The high share was made possible due to the total elimination of middlemen intervention between producers and consumers. The producers share in consumer rupee in channel II, III and IV was lower than channel I because the producers marketed their produce through the wholesaler and retailer who reaped away large amount from the consumers rupee. Next to channel I (i.e. sale through retailer) was comparatively profitable channel for sale of rabbi onion in the study area.
Wholesalers buy and sell large quantities of farm products, usually in wholesale and terminal markets. The wholesalers net margin share was (5.38%) of consumers rupee in channel II. It was also observed that the quantity of onion by this agency was very large compared to the retailers.
All market activities come to an end with the retailers. Retailers buys and sells small quantities of product according to the demand of consumers in the area. The net margin of retailers in consumers price was worked out to (7.08%) and (6.88%) in channel III and channel IV, respectively.
The net marketing margins for wholesalers and retailers in study area. At trader level, wholesalers generally got higher marketing margins than retailers got higher marketing margins than wholesalers. The percentage share of marketing margins in consumers price paid was (6.94%), (23.21%), (25.24%) and (31.18%) in channel I, II, III and IV respectively. The marketing was highest in channel IV, while it was lowest in absence fluctuations.
Most commonly used measures are convectional output to input ratio, Shephered’s ratio of value of goods marketed to the Shephered (1965) and Acharya’s modified marketing efficiency formula Acharya and Agarwal (2001). However, all these measures do not consider explicitly the loss in the produce during the marketing process. As reduction of loss in itself is one of the important efficiency parameters, there is a need to consider this component explicitly in the analysis to improve the measures of marketing efficiency ratios used for comparing alternate market channels. The present study, therefore, incorporated marketing loss as one of the components in the denominator of the formula suggested by Gadre et al.(2003). Higher the ratio on the higher the efficiency and vice versa. The result presented in Table 5 reveal that marketing efficiency was estimated by using below formula.
Where,
ME = Index of measuring efficiency
V = Value of good sold (consumer price)
I = Total marketing cost
The marketing efficiency ratio was higher in the channel I mainly because of higher price realization by the farmers due to reduced marketing cost [Table-5] . Marketing efficiency calculating using only Shepherd formula was much higher in channel I (13.41) than in channel II (4,61), channel III (4.51) and channel IV (4.13). This means that the higher marketing margins taken away by the market intermediaries in channel II, III and channel IV resulted in poor efficiency recorded by them. These results agree with the records of Guraha et at. (2007) for rice marketing and Gadre et al (2003), Suryawanshi (2005) for onion marketing. Similar results have been reported in few other studies Krishna (1976), Subrahmanyan et al. (1994), Gajanana and Subrahmanyan (1996), Patil ( 1987), Lale (1967) and (1971).
The result obtained in respect of six months maintenance cost and returns for various categories of onion cultivation are in with during the year 2010-11. In view of the major cost on labour, there is immediate need to develop the labour saving practices such as use of weedicides, improved tools for planting, harvesting etc. On the other hand, market intermediaries are accruing higher margin by in incurring less cost and services. The major share of consumers rupees is pocketed by the middlemen. The marketing efficiency was low. Therefore, in order to regulate the expenditure on commission, transportation and packing, efforts should be made to develop the necessary infrastructure for the marketing of onion in the district. The co-operative marketing should be encouraged to increase the producers share in consumers rupee. Government intervention is also necessary to safeguard the interest of farmers. Efforts should, therefore, be made to boost the export trade of tis valued crop by enhancing its production volume.
[1] Barakade A.J. and Lokhandde T.N. (2011) Hi- Tech Research Analysis Research Journal Vol.I, Issue.1, pp.80-88.
» CrossRef » Google Scholar » PubMed » DOAJ » CAS » Scopus
[2] Farooqui A. (1958) Agricultural Marketing in Pakistan. Amin Book Company, Karachi, Pakistan.
» CrossRef » Google Scholar » PubMed » DOAJ » CAS » Scopus
[3] Kairesur V.R.(1987)An economic analysis marketing of vegetable in Hubli, Dharwad markets. Unpublished Thesis submitted to UAS, Dharwad.
» CrossRef » Google Scholar » PubMed » DOAJ » CAS » Scopus
[4] Kohls R. and Uhl J. (1980) Marketing of Agricultural Products New York, Mc Millan Publishing Company U.S.A.
» CrossRef » Google Scholar » PubMed » DOAJ » CAS » Scopus
[5] Krishna P.V. (1976) Indian Journal of Agricultural Marketing Vol.7 (1) pp.27-32.
» CrossRef » Google Scholar » PubMed » DOAJ » CAS » Scopus
[6] Lale U.(1967) Journal of Agricultural Economic. Vol.15: pp.1-7.
» CrossRef » Google Scholar » PubMed » DOAJ » CAS » Scopus
[7] Lale U. (1971) Food marketing in India: Private performance and public policy Ithaca, New York, Corenell University Press.
» CrossRef » Google Scholar » PubMed » DOAJ » CAS » Scopus
[8] Patil P.S. and Jadhav D.V. (1987) Adoption of cultivation practices of onion in North- West Maharashtra Extn. 6: pp.153 - 157.
» CrossRef » Google Scholar » PubMed » DOAJ » CAS » Scopus
[9] Shaymsundar M.S. and Lalith Achoth (1996) Indian Journal of Agricultural Marketing.
» CrossRef » Google Scholar » PubMed » DOAJ » CAS » Scopus
[10] Shepherd G.S. (1965) Farm Products-Economic Analysis, Low State university Press, USA. pp. 254.
» CrossRef » Google Scholar » PubMed » DOAJ » CAS » Scopus
[11] Subrahmanyam K.V.(1996) Post harvest losses in horticultural crops. An appraisal, Agricultural situation India. Vol.41 (Aug) pp. 349-343.
» CrossRef » Google Scholar » PubMed » DOAJ » CAS » Scopus
[12] Subrahmanyam K.V., Gajannana T.N. and Sudha M. (1994) Indian Journal of Agricultural Marketing Vol.8 (2) pp. 186-193.
» CrossRef » Google Scholar » PubMed » DOAJ » CAS » Scopus
[13] Thakur D.S. and Singh N. (1971) Agricultural Marketing 13 (4): pp.11-14.
» CrossRef » Google Scholar » PubMed » DOAJ » CAS » Scopus
 | Fig. 1- |
 | Fig. 2- |
 | Fig. 3- |
 | Fig. 4- |
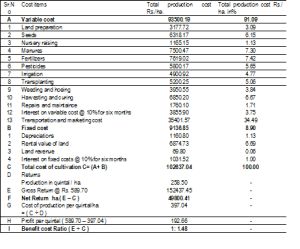 | Table 1- Cost and returns from onion production per quintal/ha.2010-11 (all cost considered). Source: Based on Field work (2010-11) |
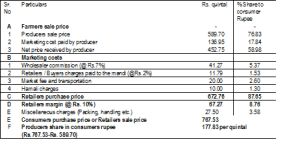 | Table 2- Price spread of onion Source: Based on field work 2010-11 |
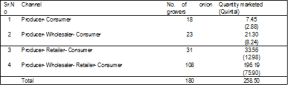 | Table 3- Channel-wise distribution of onion marketed. Source: Based on Field work |
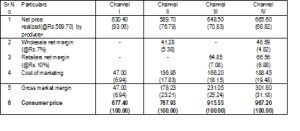 | Table 4- Per quintal price spread and returns of onion obtained through different channels. Source: Based on Field work. |
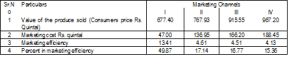 | Table 5- Marketing efficiency (ME) in marketing of onion. Source: Complied by Researcher |