ISSN : 0975-5276
EISSN : 0975-9174

KILAMBO D.L.1*, GUERRA-GUIMARÃES L.2, MABAGALA R.B.3, VARZEA V.M.P.4, HADDAD F.5, LOUREIRO A.6, TERI J.M.7
1Tanzania Coffee Research Institute, P.O. Box 3004, Moshi, Tanzania.
2Instituto de Investigação CientÃfica Tropical, Quinta do Marquês 78-505 Oeiras, Portugal.
3Sokoine University of Agriculture, P.O. Box 3005, Morogoro, Tanzania.
4Instituto de Investigação CientÃfica Tropical, Quinta do Marquês 78-505 Oeiras, Portugal.
5Universidade Federal de Viçosa, Departamento de Fitopatologia. Av. P. H. Rolfs, s/n. 6570-000. Viçosa, MG, Brasil.
6Instituto de Investigação CientÃfica Tropical, Quinta do Marquês 78-505 Oeiras, Portugal.
7Tanzania Coffee Research Institute, P.O. Box 3004, Moshi, Tanzania.
* Corresponding Author : dkilambo@gmail.com
Received : 18-02-2013 Accepted : 11-03-2013 Published : 18-03-2013
Volume : 5 Issue : 2 Pages : 382 - 389
Int J Microbiol Res 5.2 (2013):382-389
DOI : http://dx.doi.org/10.9735/0975-5276.5.2.382-389
Strains of Colletotrichum kahawae from different coffee growing areas in Tanzania, Kenya and Cameroon were studied for their different characters. Characterization was done through the application of iso-enzyme whereby morphological attributes were studied to determine variability of C. kahawae. Application of iso-enzymes involved extraction of proteins from the mycelia of each of the strain and the content was determined using Bio-Rad protein assay kit. The strains were Tanzania (14), Kenya (2) and Cameroon (1), and Colletotrichum gloeosporioides. The protein content of C. kahawae strains were compared for their reaction to iso-enzymes based on the activity of esterace, acid and basic phosphotase using the technique of isoelectic focusing electrophoresis (IEF). It was possible to detect a high esterase activity portraying many bands per strain of C. kahawae, but lower in the case of basic and acid phosphatase. However all enzymes revealed polymorphisms. The data matrices from enzymes pattern were formed by identifying the presence or absence of bands. A phenogram based on the estimate similarity coefficients was constructed by un-weighed pair group methods (UPGMA) using the computer software package NTSYS-PC version 2.02. The original similarity matrix was compared with the cophenetic value matrix generated from the systems of clusters. The cophenetic coefficient (r) was estimated and used as a measure of the goodness of fit. The results obtained by cluster analysis on C. kahawaeCam1 strain shows that iso-enzymatic profile of the strain is different from the rest. In the Tanzania population studied two groups were formed and C. kahawae strain T3 seemed to be different from the rest of the strain. Characteristics of Colletotrichum strains collected from different coffee growing areas were observed after 10 days of growth on MEA in darkness at temperature ranges between 15°C to 30°C. The morph cultural characteristics used to study variability of Colletotrichum spp were cultural texture, conidia shape and sizes, and growth rate. Out of 30 Colletotrichum spp isolated from diseased green coffee berries, 25 isolates were identified as Colletotrichum kahawae producing dark grey cottony, oval conidia morphology and slow growth rate. Five isolates identified as Colletotrichum gloeosporioides; growth rate ranged from 7.3 to 8.8 mm and C. kahawae ranged from 5.0 to 5.5 mm per 24 hr. at 25oC. This shows that the growth rate of C. gloeosporioides was always more rapid than that of C. kahawae. This shows that the growth rate analysis is a useful method separating C. kahawae from C. gloeosporioides. Conidia sizes of C. kahawaestrains were variable even within one strain. However based on this study, variability in spore size can not be used to distinguish the strains of C. kahawae.
Characterization; C. kahawae; Iso-enzymes, Morpho-cultural attributes.
Coffee berry disease (CBD) is an anthracnose of green and ripe coffee cherries recorded from Coffea arabica growing area in Africa [20] . The CBD pathogen Colletotrichum kahawae is responsible for infecting green berries and ripe cherries [31] . The infection induces crop losses of between 30-60% if no control measures are taken. The identification of C. kahawae has been based on morphological and cultural characteristics, such as conidial morphology and pigmentation [9] . Morpho-cultural attributes of the CBD pathogen shows that when the isolated from host, is characterized by slow growing, dark grey to olivaceous green profuse mycelium, and setae are rarely present. However, several sub-culturing may lead the colonies of CBD isolates become indistinguishable from the morphologically extremely variable group species of Colletotrichum gloeosporioides [32] . This can be confusing and therefore makes morpho-cultural criteria not adequate for reliable differentiation among Colletotrichum spp. [1,9] . In an attempt to perform different approach of characterization, Sreenivasaprasad, et al [27] applied restriction fragment length polymorphism (RFLP) to analyze ribosomal and mitochondrial DNA, random amplified polymorphic DNA (RAPD) to analyze and sequencing of the variable internally transcribed space (TS) 1 region of rDNA used to elucidate variation of Colletotrichum spp which infect fruits. Beynon, et al [5] and Manga, et al [19] performed mutant tests of C. kahawae in the nitrate assimilation pathway and found several vegetative compatibility groups (VCGs). Recently, Loureiro, et al [18] applied iso-enzymes to study genetic variation of C. kahawae strains by examining differences in the mobility of active metabolic proteins. Horvath, et al [14] reported that the iso-enzyme analysis provides a broader view of genetic variation compared with ribosomal DNA (rDNA) analysis which determines differences in fragment sizes.
A collection of strains of the pathogen from Tanzania, Kenya and Cameroon, in addition to C. gloeosporioides isolate from coffee were examined using enzyme function (iso-enzymatic characterization) to determine the levels of variability. Studies on morphological attributes were used to complement the findings obtained on application of iso-enzymes.
Strains of C. kahawae from different coffee growing areas in Tanzania [Table-1] , Cameroon, Kenya and C. gloeosporioides were selected for iso-enzyme studies. Three agar pieces of 1 cm2 of each isolate were used to inoculate 50 ml of liquid medium (Malt Extract 3% and peptone 0.5%). After 10 days of growth at 25°C without agitation, mycelia were used for enzymatic extracts. In order to get enough mycelia, each isolate was replicated three times.
Ten-day grown mycelia of each isolate was collected on Whatman filter paper nº1 using vacuum filtration, washed several times with sterile distilled water and sodium acetate buffer (0.05 M pH 4.5) and weighed. The filtered mycelia were placed in plastic tubes and frozen at -80ºC. The frozen mycelia were freeze dried for two days, then homogenized with sodium acetate buffer (0.05 M, pH 4.5) using porcelain mortar and pestle. The homogenate was centrifuged at 20 000 g for 50 min at 4ºC. The supernatant obtained was filtered using a 0.45 mm polyethersulfone membrane placed on a disposable syringe and then dialyzed against sterile distilled water at 4ºC overnight. After dialysis the extracts were concentrated with polyethylene glycol (6000). The concentrated extracts were stored at -80ºC and then used for electrophoresis. The protein content of each sample was determined using the commercial Bio-Rad protein assay Kit as described by Bradford [6] .
Three enzymatic activities were studied by iso electro focusing (IEF) electrophoresis in a vertical slab 1.5 mm thick with 5% (w/v) polyacrylamide gel and 2% ampholytes (various pH) according to Robertson, et al [24] : esterase (EST, EC3.1.1.2), alkaline phosphatase (ALP, EC3.1.3.1) and acid phosphatase (ACP, EC3.1.3.2). IEF was performed on a Mighty Small SE 250 apparatus (Hoefer, England) and the electrode solutions used were 25 mM NaOH (catode) and 20 mM acetic acid (anode) for all the enzymes. Twenty mg of protein was loaded per lane and the electrophoresis was conducted at a constant voltage of 200 V for 50 min followed by another 50 min at a constant voltage of 400 V. After electrophoresis, the gels were incubated in different substrate solutions according to the enzyme under study; EST [22] , ACP [12] and ALP [25] , and then scanned in an Image Scanner (Amersham Biosciences). The numbers of enzymatic bands on zymograms were evaluated using the Image QuantTM TL image analysis software (GE Life Sciences).
Data matrices from enzyme patterns were formed by identifying the presence (1) or absence (0) of a particular band. A genetic similarity matrix was calculated based on Jaccard coefficient [SJ=a/(a+b+c): where a are the bands present in both isolates being compared, b are the bands present only in the first isolate and c are the bands present only in the second isolate]. A phenogram based on the estimate similarity coefficients was constructed by UPGMA (un-weighed pair group methods analysis) using the computer software package NTSYS-pc version 2.02. The original similarity matrix was compared with the cophenetic value matrix generated from the systems of clusters. From the comparison of these two matrixes, the cophenetic coefficient (r) was estimated and used as a measure of the goodness of fit.
Surveys were made in three coffee growing areas in Tanzania represented by the Lake zone and Kigoma (Tarime, Ngara and Kigoma), Northern (Kilimanjaro and Arusha) and Southern highlands (Mbeya and Ruvuma) [Fig-1] . Green coffee berries infected with CBD at the black lesion stage were collected from each coffee growing areas mentioned above and preserved in a paper bag. Inside the paper bag, green infected berry samples were sandwich between layers of newspaper and kept in a cool box at 18°C to 20°C for the pathogen to be viable for successful subsequent isolation [16] .
Colletotrichum kahawae was isolated from the survey samples using the method described by Beynon, et al [5] . Infected green coffee berries with CBD lesions were surface sterilized by immersing in a 5% solution of sodium hypochlorite (available chlorine 0.5% W/V) for 15 min and rinsed in three changes of sterile distilled water. Infected coffee berry tissues were then removed aseptically and incubated on distilled water agar at 22oC. Hyphae from advancing edges of the tentative C. kahawae colonies were then transferred to Malt Extract Agar (MEA) [5] . The cultures were incubated at 22°C for 10 days to allow colony growth. Preliminary confirmatory tests of colony texture of C. kahawae isolates on MEA were based on mycological colour chart developed by Rayner [23] .
Using a sterile loop, tentative C. kahawae spores were scraped from 10-day-old cultures grown on MEA. The spores were mounted on glass slides in cotton blue for microscopic examination as described in the Plant Pathologists’ Pocket Book [16] . Dimensions (length and width) of five conidia per isolate were measured using an eye piece micrometer with an Olympus microscope at a magnification of x 40. The spore shape was also determined as described by Funder [10] .
Spores of each C. kahawae isolate were also obtained after 10 day incubation of 20 green infected coffee berries of a susceptible variety N 39. Tentative spores of C. kahawae were collected from coffee berries by putting the 20 sporulating berries into conical flasks containing 10 ml of sterilized distilled water. Spores were detached from the berries by shaking the berries for 5 seconds and the resulting suspension was then filtered to get spores. Drops of 0.02 ml of spore suspensions were put on sterile glass slides and observed under the compound microscope [29] . The dimensions (mm) of five conidia per tentative C. kahawae isolate were determined using an eye piece micrometer with an Olympus microscope at a magnification of x 40. The spore shape was determined as described by Funder [10] .
All isolates presumed to be C. kahawae were grown on MEA in 85 diameter glass petri dishes, replicated six times and incubated in the darkness at 25°C. After eight days of incubation, the diameters of the fungal colonies were recorded; six replicates and two measurements per replicate were taken. Growth rate at Lyamungu was determined at 25°C. At Centro de Investigação das Ferrugens do Cafeeiro (CIFC) tentative isolates of C. kahawae were evaluated at 15°C, 20°C, 25°C and 30°C. The C. kahawae strains Ca1 from Cameroon and Que2 from Kenya which were considered as standard (control) strains for comparison were also included in the current study. Mean diameter of the fungal colony growth per each isolate and the rate of colony growth in mm/24 hr. were determined and the differences between means were determined using the Duncan’s Multiple Range Test [11] .
Out of the three enzymatic systems studied by the IEF electrophoresis technique, only EST and ACP activities were consistently detected and bands easily visualized for all strains of Colletotrichum [Fig-2abc] and [Fig-3abc] .
The alkaline phosphatase (ALP) pattern showed a very low activity among Tanzanian Colletotrichum kahawae strains; this was in contrast to what was observed for the other strains of the fungus (Kenya and Cameron C kahawae and C. gloeosporioides strains) [Fig-4abc] . EST zymograms of Tanzanian C. kahawae strains had the highest activity producing many bands per strain and showing a high degree of polymorphism, although by cluster analysis it was not possible to separate the two species (phenogram [Fig-5] ). ACP zymograms showed few and clear bands per strain but with a low degree of polymorphism Fig-3a, Fig-3b. In the case of ALP zymograms, the activity was detected only in some of the Tanzanian strains Fig-4a, Fig-4b. On the other hand, by cluster analysis, both phosphatases (ACP and ALP alone) clearly differentiated C. kahawae from C. gloeosporioides (phenogram [Fig-6] and [Fig-7] ). Cluster analysis of all Colletotrichum strains based on the banding patterns obtained for the three enzymes, established two main clusters (similarity coefficient of 42%) (Phenogram [Fig-8] ). Cluster I with all the C. kahawae strains (except Cam1) and cluster II with the C. gloeosporioides and C. kahawae Cam1 strain. Within cluster I, two different groups were formed, cluster Ia only with Tanzania strains (similarity coefficient of 61%), and cluster Ib with Tanzania and Kenya strains (similarity coefficient of 65%).
Iso-enzymes were used successfully to detect genetic variation among Fusarium species in Sorghum, Colletotrichum graminicola strains from Sorghum species, Zea mays L and in the analysis of some wood decay fungi [4,14,15,17] also used iso-enzymes to study variation among Phytopthora coloeasiae strains from South-east Asia and the Pacific whereby clear bands allowed differention of distinct strains that are genetically variable within and between countries. The use of isoenzymes made it possible also to detect and analyze inter and intra specific diversity of Pratylencus species [2] . Mohamed, et al [21] used isoenzymes to identify genetic diversity of Fusarium oxysporum. Although the result obtained in this study using isoenzymes are preliminary, the presence or absence of bands per enzyme and strain, suggests of being variation of C. kahawae strains within and between countries.
The results obtained by cluster analysis on C. kahawae Cam1 strain are similar to the ones obtained previously by Loureiro, et al [18] . The isoenzymatic profile of this strain is different from all the others and reported to be one of the most virulent on C. arabica genotype in Africa [30] .
Fourteen C. kahawae strains were studied for their variability whereby, two groups were formed. Accordingly, the bands of C. kahawae strain T3 seemed to be different from the rest of the Tanzanian strains [Fig-2abc] and [Fig-3abc] . C. kahawae strains Que (Kenyan), Cam (Cameroon) and that of C. gloeosporioides beared distinctive patterns [Fig-2abc] , [Fig-3abc] and [Fig-4abc] . The fact that C. kahawae strain T3 shows distinctive patterns and at the same time being the most pathogenic, may suggest that variability in polymorphisim of C. kahawae strains can be linked to virulence characteristics.
The morpho-cultural characteristics of the strains collected from Tanzania were observed after 10 days of growth on MEA in darkness at 25°C. The results showed that out of 30 isolates, 25 were identified as C. kahawae and produced dark grey cottony colonies [Fig-9] , oval conidia morphology and slow growth rate [Table-2] . Five isolates 2006/2, 2006/3, 2006/17, 2006/18 and 2006/30 were identified as C. gloeosporoides, based on colony texture [Fig-10] , conidia morphology and size, and growth rates ranging from 5.0 to 5.5 mm per 24 hr. at 25°C [Table-2] . Conidia of 25 strains of C. kahawae varied in size [Table-3] . Growth rates of the 30 Colletotrichum species varied significantly (P £ 0.05) [Table-2] . The growth rate of C. gloeosporoides was always more rapid than that of C. kahawae.
Morpho-cultural characteristics used to study variability of C. kahawae strains were cultural texture, conidial shape and sizes, and growth rates. These characters have been reported by other scholars in distinguishing variability of Colletotrichum species [3,8,9,26] . In these studies, dark grey cottony colonies was a distinctive characteristic observed on the 25 C. kahawae strains grown on MEA, and this distinguished it from other Colletotrichum species isolated from diseased coffee berries. Similar observations reported by Hindorf [13] , Waller [31] , Waller, et al [32] . The morpho-cultural characteristics of the five strains 2006/2, 2002/3, 2006/17, 2006/18 and 2006/30 were closely related to C. gloeosporioides [Table-2] . These fungal colonies of C. gloeosporioides strains were found to grow faster than 25 strains of C. kahawae [Table-2] .
It can be suggested that colony growth rate analysis can be used to separate the two Colletotrichum species [7,18,32] and assist to reveal the true identity of C. kahawae strains.
The conidia sizes of C. kahawae strains were variable even within one strain [Table-3] . Comparisons of conidia size using DMRT test showed that conidia of C. kahawae strains 2006/15, 2006/8, 2006/27, 2006/23, 2006/24 and 2006/14 were significantly larger (P<0.05) than the rest of the strains on MEA [Table-3] . The strains from green berries (2006/8, 2006/13, 2006/24, 2006/23, 2006/1, 2006/10, 2006/9, 2006/20, 2006/16 and 2006/14) were significantly larger than that of the other C. kahawae strains. On the other hand, strains 2006/8, 2006/14, 2006/23 and 2006/24 were consistent in spore production on both MEA and green berries. Conidia lengths of C. kahawae were more variable when grown on MEA and green coffee berries.
Spore morphology of the 25 C. kahawae strains was oval, but their sizes varied both within and between the strains. The spore length ranged from 8 to 18 mm and width ranged from 2 to 6 mm. However, C. Kahawae strains 2006/8, 2006/9 and 2006/10 all from Mbinga coffee ecosystem had significantly larger spores on green berries than was the case with the rest of the strains [Table-2] . The range of spore size tended to overlap between the isolates thus, making it difficult to distinguish the strains of C. kahawae by spore size [Table-2] and [Table-3] . Talhinhas, et al [28] indicated variability in conidia size within and between strains when studying the diversity of Colletotrichum species in olive anthracnose and concluded that it is difficult to distinguish fungal strains using spore size. Despite their variation the spore size of 25 C. kahawae strains in this study fell within the range of 10.8-23.0 x 3.4-4.7 um as described by Hindorf [13] . Based on these studies, variability in spore size of C. kahawae strains on green coffee berries can not be used to distinguish the strains because there was no correlation between these two factors.
Reaction of C. kahawae strains from Tanzania to iso-enzymatic systems showed high polymorphism by EST, but low in ACP. The existence of polymorphism variability on the iso-enzymatic may suggest variability in pathogenic characteristics, an area which need to be further studied.
This study has indicated that texture characteristic of dark grey cottony colonies, oval conidia morphology and slow growth rate are the key preliminary morpho-cultural attributes in the identification of C. kahawae from other Colletotrichum isolates. Also the study found that growth rate analysis is a useful method of separating C. kahawae from C. gloesporoides, and therefore obtaining a true identity of C. kahawae strains. However, based on the findings of this study, spore size can not be used to distinguish the strains of C. kahawae because there is no distinct spore sizes related to each of the strains.
We wish to thank the European Union in Tanzania for their generous financial support through Coffee Research and Technology Support Programme which enabled us to publish this work. We also thank Tanzanian coffee growers who contribute to our research and development activities. The authors are indebted to CIFC for valuable technical input and advice which enabled successful write-up of this scientific paper. Our gratitude is also extended to SUA for reviewing and supervision of the paper. We wish to thank TaCRI Board of Directors, its Technical Advisory Panel and management for direct contribution to the successful documentation of the work. It is also our pleasure to thank Mrs. J. M. Urassa for isolation of the C. kahawae strains and Ms. Sandra for further purification of the strains.
[1] Afanador-Kafuri L., Minz D., Maymon M. and Freeman S. (2003) Phytopathology, 93, 579-587.
» CrossRef » Google Scholar » PubMed » DOAJ » CAS » Scopus
[2] Andres M.F., Pinochet J., Hernanndez-Dorrego A. and Delibres A. (2000) Journal of Plant Pathology, 49, 640-649.
» CrossRef » Google Scholar » PubMed » DOAJ » CAS » Scopus
[3] Alvarez E., Mejia J.F., Llano G. and Loke J. (2006) Valle del Cauca, Colombia.
» CrossRef » Google Scholar » PubMed » DOAJ » CAS » Scopus
[4] Annesi T., Coppola R. and Motta E. (2003) Journal of Plant Pathology, 85(2), 87-90.
» CrossRef » Google Scholar » PubMed » DOAJ » CAS » Scopus
[5] Beynon S.M., Coddington A., Lewis B.G. and Varzea V. (1995) Physiological and Molecular Plant Pathology, 46, 457-470.
» CrossRef » Google Scholar » PubMed » DOAJ » CAS » Scopus
[6] Bradford M.M. (1976) Analytical Biochemistry, 72, 284-254.
» CrossRef » Google Scholar » PubMed » DOAJ » CAS » Scopus
[7] Chen Z., Liang J. and Rodrigues C.J. (2005) Biotechnology Letters, 27, 679-682.
» CrossRef » Google Scholar » PubMed » DOAJ » CAS » Scopus
[8] Eshetu D. and Waller J.M. (2003) Crop Protection, 22, 561-565.
» CrossRef » Google Scholar » PubMed » DOAJ » CAS » Scopus
[9] Freeman S., Katan T. and Shabi E. (1998) Plant Disease, 82, 596-605.
» CrossRef » Google Scholar » PubMed » DOAJ » CAS » Scopus
[10] Funder S. (1968) Practical Mycology Manual for Identification of Fungi, Hafneer Publishing Company, Inc., New York and Kingston-Upon-Thames, 113.
» CrossRef » Google Scholar » PubMed » DOAJ » CAS » Scopus
[11] Gomez K.A. and Gomez A.A. (1984) Statistical procedures for Agricultural Research, 2nd ed., John Wiley & Sons, New York.
» CrossRef » Google Scholar » PubMed » DOAJ » CAS » Scopus
[12] Guedes M.E.M (1988) Broteria Genetica, LX, 83-92.
» CrossRef » Google Scholar » PubMed » DOAJ » CAS » Scopus
[13] Hindorf H. (1970) Pfl schutz., 77, 328-331.
» CrossRef » Google Scholar » PubMed » DOAJ » CAS » Scopus
[14] Horvath B.J. and Vargas J.M. (2004) Plant Disease, 88(4) 402-406.
» CrossRef » Google Scholar » PubMed » DOAJ » CAS » Scopus
[15] Huang L.D. and Backhouse D. (2006) Plant Science, 171, 539-545.
» CrossRef » Google Scholar » PubMed » DOAJ » CAS » Scopus
[16] Johnston A. and Booth C. (1983) Plant Pathologist’s Pocketbook, Commonwealth Mycological Institute, Kew, Surrey, England, 323.
» CrossRef » Google Scholar » PubMed » DOAJ » CAS » Scopus
[17] Lebot V., Herail C., Gunua T., Pardales J., Prana M., Thongjiem M. and Viet N. (2003) Plant Pathology, 52, 303-313.
» CrossRef » Google Scholar » PubMed » DOAJ » CAS » Scopus
[18] Loureiro A., Varzea V., Guerra-Guimaraes L., Ribeiro A., Silva M. and Bertrand B. (2006) 21st International Conference on Coffee Science, Montpellir, France, 1277-1283.
» CrossRef » Google Scholar » PubMed » DOAJ » CAS » Scopus
[19] Manga B., Bieysse D., Bedimo Moven J.A., Akalay I., Bompard E. and Berry D. (1998) 17th International Conference on Coffee Science (ASIC), Nairobi, Kenya. 97-171.
» CrossRef » Google Scholar » PubMed » DOAJ » CAS » Scopus
[20] Masaba D and Waller J.M. (1992) CAB International Mycological Institute, UK, 237-249.
» CrossRef » Google Scholar » PubMed » DOAJ » CAS » Scopus
[21] Mohamed M., Amini pour M. and Banihashemi Z. (2004) Journal of Phytopathology, 152, 267-276.
» CrossRef » Google Scholar » PubMed » DOAJ » CAS » Scopus
[22] Nave E.B. and Sauhey V.K. (1986) Journal of Plant Physiology, 125, 451-465.
» CrossRef » Google Scholar » PubMed » DOAJ » CAS » Scopus
[23] Rayner R.W. (1970) Commonwealth Mycological Institute, Kew, Surrey, UK.
» CrossRef » Google Scholar » PubMed » DOAJ » CAS » Scopus
[24] Robertson E.F., Dannelly H.K., Mallory P.J. and Reeves H.C. (1987) Analytical Biochemistry, 167, 290-294.
» CrossRef » Google Scholar » PubMed » DOAJ » CAS » Scopus
[25] Scandalios J.G. (1969) Biochemical Genetics, 3, 37-39.
» CrossRef » Google Scholar » PubMed » DOAJ » CAS » Scopus
[26] Sharma P.N., Kaur M., Sharma O.P., Sharma P. and Pathania A. (2005) Journal of Phytopathology, 153(4), 232-237.
» CrossRef » Google Scholar » PubMed » DOAJ » CAS » Scopus
[27] Sreenivasaprasad S., Brown A.E. and Mills P.R. (1993) Mycol. Res., 97(8), 995-1000.
» CrossRef » Google Scholar » PubMed » DOAJ » CAS » Scopus
[28] Talhinhas P., Screenivasaprasad S., Neves-Martins J. and Oliveira H. (2005) Applied Environmental Microbiology, 71(6), 2987-2998.
» CrossRef » Google Scholar » PubMed » DOAJ » CAS » Scopus
[29] Van der Vossen H.A.M., Cook R.T.A. and Murakaru G.N.W. (1976) Euphytica, 25, 733-745.
» CrossRef » Google Scholar » PubMed » DOAJ » CAS » Scopus
[30] Varzea V.M.P, Rodriques C.J., Silva M.C., Pedro J.P. and Marques D.M. (1999) 18th International Conference on Coffee Science (ASIC), Helsink, Finland, 516-519.
» CrossRef » Google Scholar » PubMed » DOAJ » CAS » Scopus
[31] Waller J.M. (1982) First Regional Workshop on Coffee Berry Disease. Association for Advancement of Agricultural Science in Africa (AAASA), Addis Ababa, 125-130.
» CrossRef » Google Scholar » PubMed » DOAJ » CAS » Scopus
[32] Waller J.M., Bridge P.D., Black R. and Hakiza G. (1993) Mycological Research, 97, 989-994.
» CrossRef » Google Scholar » PubMed » DOAJ » CAS » Scopus
 | Fig. 1- Map of Tanzania showing areas where Colletotrichum isolates were collected March to July 2006 Locations where Colletotrichum kahawae isolates were collected are shown with Red oval. |
 | Fig. 2abc- Zymograms of esterases isoenzymes of C. kahawae strains from Tanzania (3, 10, 13, 14, 16, 17, 18, 20, 22, 23, 25, 28, 29, 30), Cameroon (Cam), Kenya (Q71 and Q72) and one Colletotrichum gloeosporoides strain from China (Chi). Std-IEF standards broad Range pl 4,45-9,6 (Bio-Rad)-. Twenty mg of protein was loaded per lane. |
 | Fig. 3abc- Zymograms of acid phosphatase isoenzymes of Colletotrichum kahawae strains from Tanzania (3, 10, 13, 14, 16, 17, 18, 20, 22, 23, 25, 28, 29, 30), Cameroon (Cam), Kenya (Q71 and Q72) and one Colletotrichum gloeosporoides strain from China (Chi). Std – IEF standards broad Range pl 4,45-9,6 (Bio-Rad)-. Twenty mg of protein was loaded per lane. |
 | Fig. 4abc- Zymograms of alkaline phosphatase isoenzymes of Colletotrichum kahawae strains from Tanzania (3, 10, 13, 14, 16, 17, 18, 20, 22, 23, 25, 28, 29, 30), Cameroon (Cam), Kenya (Q71 and Q72) and one Colletotrichum gloeosporoides strain from China (Chi). Std – IEF standards broad Range pl 4,45-9,6 (Bio-Rad)-. Twenty mg of protein was loaded per lane. |
 | Fig. 5- Phenogram resulting from cluster analysis based on esteraces zymogram for Colletotrichum kahawae strains from Tanzania (3, 10, 13, 14, 16, 17, 18, 20, 22, 23, 25, 28, 29, 30), Cameroon (Cam), Kenya (Q 71 and 72) and one Colletotrichum gloeosporioides strain from China (Chi), using Jaccard’s similarity coefficient (correlation coefficient, r+0.83859) |
 | Fig. 6- Phenogram resulting from cluster analysis based on acid phosphatase zymogram for Colletotrichum kahawae strains from Tanzania (3, 10, 13, 14, 16, 17, 18, 20, 22, 23, 25, 28, 29, 30), Cameroon (Cam), Kenya (Q71 and Q72) and one Colletotrichum gloeosporoides strain from China (Chi), using Jaccard’s similarity coefficient (correlation coefficient, r=0.85014) |
 | Fig. 7- Phenogram resulting from cluster analysis based on alkaline phosphatase zymogram for Colletotrichum kahawae strains from Tanzania (3, 10, 13, 14, 16, 17, 18, 20, 22, 23, 25, 28, 29, 30), Cameroon (Cam), Kenya (Q71 and Q72) and one Colletotrichum gloeosporoides strain from China (Chi), using Jaccard’s similarity coefficient (correlation coefficient, r=0.98117) |
 | Fig. 8- Phenogram resulting from cluster analysis based on esterase, acid and alkaline phosphatases zymograms for Colletotrichum kahawae strains from Tanzania (3, 10, 13, 14, 16, 17, 18, 20, 22, 23, 25, 28, 29, 30), Cameroon (Cam), Kenya (Q71 and Q72) and one Colletotrichum gloeosporoides strain from China (Chi), using Jaccard’s similarity coefficient (correlation coefficient, r=0.86367) |
 | Fig. 9- Growth of Colletotrichum kahawae 15 days on Malt Extract Agar (2 %) |
 | Fig. 10- Growth of Colletotrichum gloeosporioides 8 days on Malt Extract Agar (2%) |
 | Table 1- List of Colletotrichum kahawae strains from different coffee growing areas in Tanzania m.a.s.l = metres above sea level |
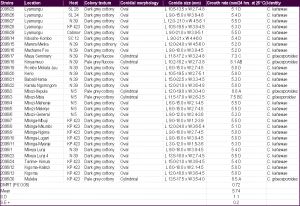 | Table 2- Morphocultural characteristics of Colletotrichum isolates collected from different coffee ecosystems in Tanzania Means followed by a common letter within a column do not differ significantly according to DMRT (P £ 0.05). |
 | Table 3- Conidial sizes of Colletotrichum kahawae strains collected from different coffee ecosystems in Tanzania Means followed by a common letter within a column do not differ significantly according to DMRT (P £ 0.05). |