


ISSN : 0976-996X
EISSN : 0976-9978



NIKKHAH A.1*
1Department of Animal Sciences, University of Zanjan, Zanjan 313-45195 Iran
* Corresponding Author : nikkhah@znu.ac.ir
Received : 29-06-2011 Accepted : 16-07-2011 Published : 18-07-2011
Volume : 2 Issue : 1 Pages : 13 - 16
Vet Sci Res 2.1 (2011):13-16
DOI : http://dx.doi.org/10.9735/0976-996X.2.1.13-16
Conflict of Interest : None declared
The objective was to determine effects of feeding time and dietary forage to concentrate ratio on 24-h rhythms and averages of peripheral blood urea (BU). Four multiparous (body weight, BW = 652 ± 14 kg; body condition score, BCS = 2.87 ± 0.14, days in milk, DIM = 83 ± 22) and four primiparous (BW = 667 ± 110 kg, BCS = 3.19 ± 0.66, 81 ± 23 DIM; mean  SD) Holstein cows were used in a 4 × 4 Latin square design study with a 2 × 2 factorial arrangement of feeding time and diet type. A higher concentrate (HC, forage to concentrate ratio = 38.5:61.5) or a lower concentrate (LC, forage to concentrate ratio = 50.6:49.4) total mixed ration (TMR) was offered at either 2100 h or 0900 h. The study had four 21-d periods, each with 14-d adaptation. Blood was sampled every 2-h for two 24-h periods during sampling weeks. Feeding at 2100 h vs. 0900 h increased feed amount consumed within 3-h post-feeding from 26% to 37% of total daily intake. Total daily dry matter intake was similar among treatments. Blood urea exhibited significant 24-h rhythms in both parities, which depended on diet type and its interactions with sampling hour and time of feeding. Results demonstrate that time of feeding and thus time of major eating alter postprandial and 24-h patterns of feed intake and BU. Time of eating and its interaction with diet type can therefore affect splanchnic and peripheral nitrogen metabolism and efficiency in lactating cows.
Blood urea, evening feeding, intake, diurnal rhythm, physiology
Livestock are economical models to study human physiology. Human physiology is regulated by external stimuli such as time of eating and photoperiod [1,2] . The external stimuli alter diurnal patterns of food intake and hepato-gastrointestinal dynamics [1,3] . The splanchnic tissue involving gut and liver regulate peripheral substrate distribution [4,5] . Hence, factors affecting diurnal patterns of splanchnic nutrient flow will alter peripheral nutrient use and partitioning.
Provision of fresh feed determines diurnal patterns of eating activity in lactating cows [6,7] . Diurnal rhythms of blood urea (BU), glucose, BHBA, NEFA and insulin have been observed in transition and early lactation cows [8,9] . Diurnal patterns of nutrient intake and blood hormones could partly explain diurnal rhythms of circulating blood metabolites [1,10,11] . Alterations in postprandial patterns of food intake are expected to alter postprandial rhythms of rumen ammonia and pH and thereby alter post-rumen and post-absorptive N turnover [12,13] . Accordingly, hepatic release of urea, glucose, and amino acids (AA) can change [14] .
Distributing eating times during afternoon and evening hours rather than morning hours has improved energy balance of lactating cows in summer [15] . Rumen digestion and milk fat yield was increased when a protein meal was fed at 0030 h vs. 0730 h [12] . Under normal ambient temperatures (20.4°C), Nikkhah et al. [8,16] discovered an increased milk fat production in cows fed a TMR at 2100 h vs. 0900 h. When lactating cows were fed twice daily at 0700 and 1500 h with equal amounts of feed at each delivery, blood glucose and NEFA declined after morning feeding but not after afternoon feeding [17] . The increased milk fat yield was likely a result of increased food intake and eating rate shortly post-feeding in cows fed at 2100 h vs. 0900 h [16] . Diurnal variations in glucose tolerance and insulin responsiveness have been shown in humans and rats [10,17] . In ruminants, Piccione et al. [3] recently found a nocturnal peak in body temperature. A greater nocturnal rumen fermentation has been observed in grazing dairy cows [18] . Also, evening instead of morning feeding has improved growth in beef steers [19] and heifers [20] .
Blood urea has been shown to increase shortly post-feeding in goats [3] , dairy cows [21] , and beef cows [22] . Lefcourt et al. [23] demonstrated a diurnal rhythm for BU in lactating cows fed once daily at 0900 h. Blood urea peaked at 1100 h (2-h post-feeding) and dropped until midnight after which it rose again. When transition and early lactation cows were fed twice daily at 0700 and 1300 h, BU rose after feed delivery at 0730 h but not after feed delivery at 1300 h [9] . The post-feeding response in BU could be attributed to different amounts of feed consumed after different feed deliveries. This important entity has not been quantified to date. Also, substantiated data are lacking on how timing of eating affects BU rhythmicity. Day fed cows usually eat little feed after midnight partly because fresh feed is absent [24] . As a result, the rumen fill decreases towards early morning and hunger develops. The considerable morning N intake results in a rapid rumen ammonia release that increases hepatic urea synthesis and causes a surge in BU [23] . The main objective was to delineate responses in postprandial rhythms of BU in dairy cows to eating time, diet type and their interaction
Cow Management and Experimental Design
Four multiparous (BW = 652 ± 14 kg, BCS = 2.87 ± 0.14, days in milk = 83 ± 22) and four primiparous (BW = 667 ± 110 kg, BCS = 3.19 ± 0.66, 81 ± 23 days in milk; mean  SD) lactating Holstein cows were housed in tie stalls (Glenlea Research Station, University of Manitoba, Winnipeg, Canada). Experimental procedures were according to the guidelines of the Canadian Council on Animal Care [25] . The average indoor air temperature and relative humidity were 20.4°C and 68.1%, respectively. Cows were offered either a higher concentrate diet (HC) with a forage to concentrate ratio (F:C) of 38:62, or a lower concentrate diet (LC) with a F:C of 49:51. The HC had 15.9% alfalfa silage, 22.7% corn silage, 49.8% energy supplement, 11.6% protein supplement, 18.1% CP, 28.6% NDF, 15.1% ADF, 39.7% NFC, and 5.9% fat. The respective percentages were 21.0, 29.7, 37.2, 12.2, 17.3, 33.8, 19.4, 35.9, and 5.3 for the LC diet. The total mixed rations (TMR) were delivered at either 0900 h or 2100 h.
The experimental design was a double 4 × 4 Latin square with a 2 × 2 factorial arrangement of feeding time and diet type. Each 21-d period had 14-d of adaptation and 7-d of sampling. Cows were fed to permit 5-10% orts, with unlimited access to fresh and clean water. Diurnal patterns of feed intake were monitored continuously using a data acquisition system (Grow-Safe Sys, Model 4000, Airdrie, AB). Total mixed rations were prepared every morning using a Data Ranger Mixer (American Calan, Northwood, NH) with a Weigh Tronix head (Model 1000, American Calan, Northwood, NH). Except for sampling weeks, cows were allowed for 2-h of daily exercise (0700-0900 h). Milking was performed twice daily in stalls at 0400 and 1600 h. Lights were on from 0345 until 2245 h.
The cows were catheterized in the jugular vein on the first day of the sampling weeks. The next day, the catheters were flushed with a sterilized heparinised saline solution (0.9% NaCl, and 50 unit heparin/ml). Blood samples were drawn every 2-h for two 24-h periods. Each 24-h sampling period started at 0900 h and ended at 0900 h on the next day. Catheters were flushed with 10 ml of heparinised saline solution between 2-h samplings to inhibit clot formation within catheters and extension sets. Blood samples were transferred into green-top vacutainer tubes with anti-coagulant (Na-heparin), immediately put on ice, and centrifuged at 3000 × g for 20 min at 4°C to harvest plasma. Plasma urea was determined using an automatic analyzer (Stat Profile ® Critical Xpress, 02454-9141 Nova Biomedical, Waltham, MA).
Considering the equally-spaced, repeated blood measures Mixed Models Procedure of SAS [26,27] was used to analyze the data. The time of blood sampling was the repeated factor. Cow was the subject. The effects of diet, time of feeding (TF), parity, hour, and two-, three-, and four-way interactions were considered fixed. Random effects included period, sampling day (period), cow (parity), diet × TF × parity × cow (parity), and diet × TF × parity × day (period). To account for between-hour, within-cow correlations of the repeated measures and, thus, to minimize Type 1 statistical error risks (i.e., rejection of true null hypothesis), various covariance structures were modeled [27] . Among 7 different covariance structures tested (i.e., simple, compound symmetry, first-order autoregressive, heterogeneous compound symmetry, first-order heterogeneous autoregressive, ante-dependence, unstructured), first-order heterogeneous autoregressive fitted the best for BU. To obtain normal distribution and alleviate variance heterogeneity of residuals, data were transformed using the Box-Cox algorithm [28] to acquire the power of λ that minimized the correlation between means and standard errors. Square-root transformation was applied to urea since the λ was close to 0.5 [29] . Tukey’s multiple range test was used to compare least square means. Significance was declared at P ≤ 0.05 and trends were declared at 0.05 < P ≤ 0.10. The Contrast statement of SAS [27] was used to obtain polynomial trends in diurnal patterns of BU. The mean and standard errors presented are for the original data. Probability values reported are for the analysis of transformed data.
Time of feeding altered the 24-h patterns (P < 0.001) but not daily averages of peripheral BU [Fig-1] , [Table-1] . Provision of HC both at 0900 h and 2100 h increased BU only numerically at 2-h post-feeding. Subsequently, BU decreased progressively until 6-h post-feeding in the 2100-fed cows and until 12-h post-feeding in the 0900 h-fed cows. Afterwards, it increased up to preprandial baseline. Cows fed the LC diet (and not HC) in evening instead of morning had lower BU at 4-h, 6-h and 8-h post-feeding [Fig-1] . In the 0900 h-fed LC cows, however, BU exhibited a significant rise (P < 0.05) at 2-h post-feeding that lasted until 4-h post-feeding. It then dropped gradually until 10-12 h post-feeding (P < 0.05), reaching a nadir overnight, when it started to rise for 6-h before the next feed delivery. The post-feeding rise in BU in the 2100 h-fed LC cows occurred only at 2-h post-feeding [Fig-1] . Consuming less feed within 3-h post-feeding than the 2100 h-fed cows, the 0900 h-fed cows consumed more feed between 3-6 h post-feeding. This may have probably led to some prolonged N availability and rumen ammonia production in the 0900 h-fed cows. The post-feeding rise in BU has been shown by others in cows [9,17,21] and goats [3] . The current study reveals that such patterns depend on when TMR is delivered to once-daily-fed cows.
Provision of HC vs. LC diet numerically increased BU (P = 0.12, [Table-1] ). The HC diet contained slightly higher CP than the LC diet (18.1 vs. 17.3%). Given the similar dry matter intake for HC vs. LC (20.6 kg/d), cows fed the HC diet consumed approximately 170 g more CP than the cows fed the LC diet. This may have increased rumen ammonia production [30] , which may increase energetic costs of hepatic urea formation. These suggest an increased ureogenesis for the HC cows, supporting their higher BU. The HC diet increased milk protein (3.53 vs. 3.36%), which could be due to its greater fermentable starch than the LC diet [31] . As a result, AA may be spared for milk protein secretion.
Multiparous cows tended (P < 0.10) to have higher BU than primiparous cows (5.0 vs. 4.6 mmol/L), which may partly be attributed to greater dry matter intake (22 vs. 19 kg/d) and more extensive rumen N degradation in multiparous cows. Multiparous cows produced greater milk protein than primiparous cows (1.39 vs. 1.14 ± 0.07 kg/d, P = 0.04). Therefore, multiparous cows might also have metabolized more AA to sustain the increased mammary N demands, thus likely increasing hepatic urea synthesis.
Feeding higher and lower concentrate diets at 2100 h instead of 0900 h increased feed intake within 3-h post-feeding, from 26% to 37% of total daily intake after 14-d of adaptation. Blood urea accordingly exhibited significant diurnal rhythms in both parities, which depended on diet type, sampling hour, and time of feeding. Cows fed the lower concentrate (and not the higher concentrate) diet in evening instead of morning had lower BU at 4-h, 6-h and 8-h post-feeding. Feeding time did not affect daily averages of BU. Results demonstrate that time of feeding/eating alters postprandial and 24-h patterns of feed intake and peripheral BU concentrations in once-daily-fed lactating cows. Therefore, time of eating and its interaction with diet can affect splanchnic and peripheral nitrogen metabolism and efficiency in dairy cows.
Special thanks to the Ministry of Science, Research and Technology and University of Zanjan (Iran) for supporting the author’s programs of optimizing global science education.
[1] Nikkhah A. (2011) Open Access Animal Physiology, 3, 9-12.
» CrossRef » Google Scholar » PubMed » DOAJ » CAS » Scopus
[2] Piccione G., Caola G. & Mortola J. (2004) Respiratory Physiology and Neurobiology, 140, 33-41.
» CrossRef » Google Scholar » PubMed » DOAJ » CAS » Scopus
[3] Piccione G., Caola, G. and Refinetti R. (2003) Comparative Biochemistry and Physiology, 134, 563-572.
» CrossRef » Google Scholar » PubMed » DOAJ » CAS » Scopus
[4] Danfær A. (1994) Nutrient metabolism and utilization in the liver. Livestock Production Science 39, 115-127.
» CrossRef » Google Scholar » PubMed » DOAJ » CAS » Scopus
[5] Sauvant D. (1994) Livestock Production Science, 39, 105-113.
» CrossRef » Google Scholar » PubMed » DOAJ » CAS » Scopus
[6] Phillips C.J. and Rind M.I. (2001) Journal of Dairy Science, 84, 1979-1987.
» CrossRef » Google Scholar » PubMed » DOAJ » CAS » Scopus
[7] DeVries T.J., von Keyserlingk M.A.G. and Beauchemin K.A. (2003) Journal of Dairy Science, 86, 4079-4082.
» CrossRef » Google Scholar » PubMed » DOAJ » CAS » Scopus
[8] Nikkhah A., Furedi C., Kennedy A., Crow G. and Plaizier J. (2008) Journal of Dairy Science, 91, 1-12.
» CrossRef » Google Scholar » PubMed » DOAJ » CAS » Scopus
[9] Plaizier J.C., Fairfield, A.M., Azevedo P.A., Nikkhah A., Duffield T.F., Crow G.H., Bagg R., Dick P. and McBride B.W. (2005) Journal of Dairy Science, 88, 3595-3602.
» CrossRef » Google Scholar » PubMed » DOAJ » CAS » Scopus
[10] Furedi C., Kennedy A.D., Nikkhah A. and Plaizier J.C. (2006) Advances in Dairy Technology, 18, 356.
» CrossRef » Google Scholar » PubMed » DOAJ » CAS » Scopus
[11] Vasilatos R. and Wangsness P.J. (1981) Endocrinology, 108, 300-304.
» CrossRef » Google Scholar » PubMed » DOAJ » CAS » Scopus
[12] Robinson P.H., Gill M. and Kennelly J.J. (1997) Journal of Dairy Science 80, 1366-1373.
» CrossRef » Google Scholar » PubMed » DOAJ » CAS » Scopus
[13] Robinson P.H., Gill M. and Kennelly J.J. (2002) Animal Feed Science and Technology, 97, 115-121.
» CrossRef » Google Scholar » PubMed » DOAJ » CAS » Scopus
[14] De Boer G., Trenkle A. and Young J.W. (1985) Journal of Dairy Science, 68, 326-337.
» CrossRef » Google Scholar » PubMed » DOAJ » CAS » Scopus
[15] Aharoni Y., Brosh, A. and Harari Y. (2005) Livestock Production Science 92, 207-219.
» CrossRef » Google Scholar » PubMed » DOAJ » CAS » Scopus
[16] Nikkhah A., Furedi C., Kennedy A., Wittenberg K. and Plaizier J.C. (2011) Canadian Journal of Animal Science, 91(1), 113-122.
» CrossRef » Google Scholar » PubMed » DOAJ » CAS » Scopus
[17] Blum J.W., Bruckmaier R.M., Vacher P.Y., Munger, A. and Jans F. (2000) Journal of Veterinary Medicine, 47, 43-60.
» CrossRef » Google Scholar » PubMed » DOAJ » CAS » Scopus
[18] Taweel H.Z., Tas B.M., Dijkstra J. and Tamminga S. (2004) Journal of Dairy Science, 87, 3417-3427.
» CrossRef » Google Scholar » PubMed » DOAJ » CAS » Scopus
[19] Small J.A., Kennedy A.D., Veira D.M., McCaughey W.P. and Ward D.R. (2004) Canadian Journal of Animal Science, 84, 133-144.
» CrossRef » Google Scholar » PubMed » DOAJ » CAS » Scopus
[20] Kennedy A.D., Bergen R.D., Lawson T.J., Small J.A. & Veira D.M. (2004) Canadian Journal of Animal Science, 84, 491-500.
» CrossRef » Google Scholar » PubMed » DOAJ » CAS » Scopus
[21] Gustafsson A.H. and Palmquist D.L. (1993) Journal of Dairy Science, 76, 475–484.
» CrossRef » Google Scholar » PubMed » DOAJ » CAS » Scopus
[22] Coggins C.R.E. and Field A.C. (1976) Journal of Agricultural Science, 86, 595-602.
» CrossRef » Google Scholar » PubMed » DOAJ » CAS » Scopus
[23] Lefcourt A.M., Huntington J.B., Akers R.M., Wood D.L. and Bitman J. (1999) Domestic Animal Endocrinology, 16, 41-55.
» CrossRef » Google Scholar » PubMed » DOAJ » CAS » Scopus
[24] Ominski K.H., Kennedy A.D., Wittenberg K.M. and Moshtaghi Nia S.A. (2002) Journal of Dairy Science, 85, 730-737.
» CrossRef » Google Scholar » PubMed » DOAJ » CAS » Scopus
[25] Canadian Council on Animal Care (1993) Guide to the Care and Use of Experimental Animals. Vol. 1. E. D. Olfert, B. M. Cross, and A. A. McWilliam, eds. CCAC, Ottawa, ON, Canada.
» CrossRef » Google Scholar » PubMed » DOAJ » CAS » Scopus
[26] SAS Institute, Inc. (2003) SAS/STAT user’s guide. V. 9.1. SAS Institute, Inc., Cary, NC.
» CrossRef » Google Scholar » PubMed » DOAJ » CAS » Scopus
[27] Wang Z. and Goonewardene L.A. (2004) Canadian Journal of Animal Science, 84, 1-11.
» CrossRef » Google Scholar » PubMed » DOAJ » CAS » Scopus
[28] Peltier M.R., Wilcox C.J. and Sharp D.C. (1998) Journal of Animal Science, 76, 847-849.
» CrossRef » Google Scholar » PubMed » DOAJ » CAS » Scopus
[29] Steel R.G.D., Torrie J.H. and Dickie D.A. (1997) Principles and procedures of statistics: a biometric approach. 3rd edition. Chapter, 246- McGraw-Hill Publishing Company. Toronto.
» CrossRef » Google Scholar » PubMed » DOAJ » CAS » Scopus
[30] Reynal S.M. and Broderick G.A. (2005) Journal of Dairy Science, 88, 4045-4064. 393.
» CrossRef » Google Scholar » PubMed » DOAJ » CAS » Scopus
[31] DePeters E.J. and Cant J.P. (1992) Journal of Dairy Science, 75, 2043-2070.
» CrossRef » Google Scholar » PubMed » DOAJ » CAS » Scopus
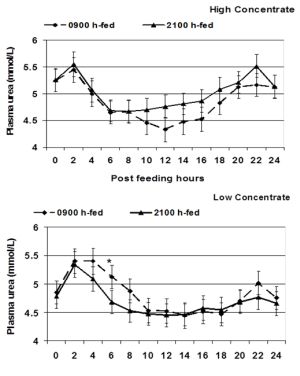 | Fig. 1- Postprandial rhythms of plasma urea concentrations in cows fed a higher (HC) or a lower concentrate (LC) diet either at 2100 or 0900 h. Within each hour, * = P < 0.05. For the LC diet at 4-h and 8-h post-feeding, evening vs. morning feed deliveries differ at P < 0.15. Also, for the comparisons of 0-h vs. 2-h and 0-h vs. 4-h post-feeding for 2100 h LC diet delivery: P < 0.05. |
 | Table-1 Effects of diet (D), time of feeding (TF), sampling hour (H), and interactions on circulating blood urea concentrations<sup>1</sup> <sup>1</sup>Least square means and standard errors are for analysis of original data. Statistical significance levels are for analysis of transformed data. <sup>2</sup>HC = higher concentrate diet, F:C = 39:61; LC = lower concentrate diet, F:C = 49:51. NS = not significant, P > 0.15; †= 0.05 < P ≤ 0.12; * = 0.01 < P < 0.05; *** = P < 0.001. |