ISSN : 0975-5276
EISSN : 0975-9174

PARTHASARATHI AJIT KUMAR1*, MUTHU ARUMUGAM2, DEEPAK ANAND3, NAMPERUMALSAMY VIJAYARANGAN4, CHANDRASEKARAN ANBUKAYALVIZHI5, MEGHA RAO6, SRINIVASAN VIJAY7, HARYADI RAJESWARI8
1Department of Microbiology and Cell Biology, Indian Institute of Science, Bangalore-560012, Karnataka, India.
2Department of Microbiology and Cell Biology, Indian Institute of Science, Bangalore-560012, Karnataka, India.
3Department of Microbiology and Cell Biology, Indian Institute of Science, Bangalore-560012, Karnataka, India.
4Department of Microbiology and Cell Biology, Indian Institute of Science, Bangalore-560012, Karnataka, India.
5Department of Microbiology and Cell Biology, Indian Institute of Science, Bangalore-560012, Karnataka, India.
6Department of Microbiology and Cell Biology, Indian Institute of Science, Bangalore-560012, Karnataka, India.
7Department of Microbiology and Cell Biology, Indian Institute of Science, Bangalore-560012, Karnataka, India.
8Department of Microbiology and Cell Biology, Indian Institute of Science, Bangalore-560012, Karnataka, India.
* Corresponding Author : ajit@mcbl.iisc.ernet.in
Received : 15-03-2012 Accepted : 03-05-2012 Published : 03-05-2012
Volume : 4 Issue : 4 Pages : 201 - 210
Int J Microbiol Res 4.4 (2012):201-210
DOI : http://dx.doi.org/10.9735/0975-5276.4.4.201-210
Nucleoside diphosphate kinase, NDK, plays a vital role in maintaining pools of nucleoside triphosphates and their respective deoxynucleoside triphosphates for the synthesis of RNA and DNA. Transcriptional regulation of ndk in mycoacteria remains unknown, although modulation of ndk expression under stress conditions involving DNA and, RNA synthesis arrest and cell division arrest had been studied in several bacterial systems. Therefore, in the present study, the start sites of transcription of ndk of Mycobacterium smegmatis (Msmndk) were identified and putative promoter regions were predicted. Using transcriptional fusions of the cloned putative promoter regions to mycobacterial codon-optimised reporter gene, gfpm 2+, promoter activity was examined under active phase of growth, nutrient starvation and other stress conditions involving DNA replication inhibition and cell division arrest. Msmndk was found to be expressed through two transcripts, T1 and T2, arising from P1 and P2 promoters, respectively. Both the promoters belonged to C group of mycobacterial promoters, which do not possess consensus to any known canonical sigma factor recognition sequences. The levels of T2, but not of T1, were found to be low under the different stress conditions studied. The data documents modulation of ndk transcripts in mycobacteria.
Nucleoside diphosphate kinase transcripts, Mycobacterium smegmatis, Transcription start site, Primer extension, Hydroxyurea, Phenethyl alcohol, nutrient-depleted stationary phase.
Nucleoside diphosphate kinase (NDK), originally discovered by Krebs and Hems [1] and Berg and Joklik [2] , catalyses the transfer of a 5’ terminal phosphate from ATP or GTP to a nucleoside diphosphate (NDP), via a phosphohistidine enzyme intermediate [3] . The primary role of NDK is to maintain nucleoside triphosphates (NTPs) and their deoxy derivatives (dNTPs) pool for the synthesis of RNA and DNA and for other biosynthetic processes in bacteria to humans [4-6] . Besides this fundamental role in nucleotide metabolism, NDK has been implicated in many other cellular functions. The ndk transcription gets downregulated by the phosphorylated ArcA under redox conditions in Escherichia coli [7] , in the classical biotype O1 of Vibrio cholerae but not in O1 El Tor biotype [8] , and in the bacterial pathogen, Chlamydia trachomatis, during the developmental cycle [9] . Similarly, E. coli ndk (Econdk) is repressed by the DNA-bending protein, HU, under aerobic conditions [10] , by the global regulator, FNR, under anaerobic conditions [11] , and by cyclic AMP receptor protein (CRP) in vitro [12] . Repression of Salmonella enterica serovar Typhimurium ndk by the DNA-binding and transcription regulatory protein, Fis [13] lowers GTP levels, thereby regulating pppGpp and ppGpp pool size. On the contrary, in Pseudomonas aeruginosa, AlgQ, which modulates the levels of alginate [14] , upregulates ndk, thereby positively regulates the levels of GTP, ppGpp, and inorganic polyphosphate (polyp) [15,16] . Similarly, under osmotic and oxidative stress conditions, ndk is upregulated in order to restore cell homeostasis in Sinorhizobium meliloti, carrying a mutation in the outer membrane protein, TolC [17] .
Although ndk deletion strain of E. coli grows normally, it shows an imbalance in NTP pools, resulting in mutator phenotypes [18] . Except for Myxococcus xanthus [19] , NDK is dispensable for many bacterial systems, including Mycobacterium tuberculosis [20] . However, a crucial role has been invoked for mycobacterial NDK in the biosynthesis of mannans and galactans for the cell wall [4] , through the synthesis of GDP-mannose and UDP-galactose, from the supply of GTP and UTP. Although biochemical characterisation of NDK of M. smegmatis [21] and M. tuberculosis [22] has been carried out, the regulation of mycobacterial NDK synthesis remains unknown. Therefore, in the present study, as the first step to understand cellular roles of mycobacterial ndk, transcriptional analysis of Mycobacterium smegmatis (Msmndk) was performed.
The start sites of transcription of Msmndk were identified, the putative promoter regions were predicted and cloned, and their activity was verified using transcriptional fusion with a highly fluorescent, mycobacterial codon-optimised GFP gene. The modulation of Msmndk transcript levels were studied under stress conditions, wherein NTP and dNTP syntheses were blocked, DNA replication was arrested, and nutrient depletion was effected .
Mycobacterium smegmatis mc2155 cells were grown in Middlebrook 7H9 (Difco) liquid medium supplemented with 0.2% glycerol, 0.05% Tween 80 and ADC enrichment or in Middlebrook 7H10 agar (Difco) medium supplemented with OADC enrichment. E. coli JM109 cells, for plasmid preparation, were grown in Luria-Bertani liquid or agar medium. Hygromycin was used at 150 mg/ml for E. coli and 50 mg/ml for M. smegmatis. Hydroxyurea (HU; USB) (200 μg/ml, final concentration) was added to 0.4 OD600 nm M. smegmatis culture and growth was continued for 9 more hrs [23] . M. smegmatis cells were harvested at 0.6 OD600 nm and treated with phenethyl alcohol (PEA; 0.4% final concentration), as described [24,25] . Nutritional depletion stress during stationary phase was achieved by keeping stationary phase culture (2.5 OD600 nm) for 15 days under non-shaking condition at 37ºC [25] .
Isolation of DNA-free total RNA from M. smegmatis cells was carried out using hot acid-phenol method, exactly as described [26] . RNA of good integrity, which gave A260/A280 ratio of 1.9 or more, was used for primer extension analysis. The start sites of transcripts were mapped using primer extension reaction, exactly as described earlier [27] . The 1791 bp segment spanning 888 bp of 3’ portion of folC, 486 bp of the hypothetical gene (MSMEG_4628), and 417 bp ndk gene of M. smegmatis (Msmndk) was amplified using Pfu DNA polymerase (MBI Fermentas) and specific primers, MsfolC-PEf and Msndkr2 [Table-1] . The PCR product was cloned in pBS-KS vector between KpnI and EcoRI sites, sequence verified, and used for cycle sequencing reactions, as described [27] For primer extension analysis, the 5’ 32P-end-labeled MsNDK-PEr [Table-1] , the 3’ end of which anneals at 14 nt downstream of the first ‘G’ of the start codon, gtg, of Msmndk, was used.
Msmndk putative promoter regions and their respective-10 deletion mutants were synthesised as the sense and complementary oligonucleotides [Table-1] , with XbaI and BamHI overhangs at the 5’ ends, respectively. Equimolar concentrations (25 μM) of the sense and complementary oligonucleotides were mixed in 200 μl of annealing buffer (10 mM Tris-HCl, pH 8.0, 50 mM NaCl, and 1 mM EDTA). The above mixture was heated in boiling water for 5 min, and was slowly cooled to room temperature. The annealed oligonucleotide duplex was precipitated by adding 1/10th volume of 3 M sodium acetate (pH 5.2), followed by 2.5 volume of ice-cold ethanol, and kept in -70ºC freezer for 12 hrs. The precipitate was spun down at 12000 rpm for 10 min, washed twice with 70% ethanol, and was resuspended in sterile water. The annealed oligonucleotide duplexes were cloned at XbaI and BamHI sites in pMN406 [26] , replacing Pimyc promoter, as transcriptional fusion to gfpm2+ reporter gene [28] . M. smegmatis cells were electrotransformed with one μg DNA each of Msmndk-P1 and Msmndk-P2 or their respective -10 deletion clones [Table-1] in BioRad electroporator, at 1.5 kV field strength, 25 μF capacitance and 200 Ω resistance. The transformants were selected in Middlebrook 7H10 agar containing hygromycin.
Total RNA was isolated from M. smegmatis cultures using Qiagen RNeasy Mini Kit following the manufacturer’s protocol with minor modifications, checked for quality on 1% formaldehyde-agarose gel, and treated with 1 U RNase-free DNase I (Fermentas) per µg of RNA. Removal of genomic DNA and plasmid DNA (containing gfpm2+) contaminations, with DNase I treatment, was verified with DNA-PCR using Ms-16S-rRNA-RTf and Ms-16S-rRNA-RTr primers and mycgfp2+-RTf and mycgfp2+-RTr primers, respectively [Table-1] . cDNA synthesis was performed using 1 µg of total RNA with mycgfp2+-RTr primer (20 pmol) and 500 ng of total RNA with Ms-16S-rRNA-RTr primer (20 pmol). RevertAid™ Premium Reverse Transcriptase (Fermentas) was used for cDNA synthesis with 0.5 mM dNTP mix and 40 U of RiboLock™ Ribonuclease Inhibitor (Fermentas). Extension of primer was performed at 60°C. Real Time PCR was carried out for 35 cycles of amplification using DyNAmo™ HS SYBR® Green qPCR Kit (Finnzyme), following manufacturer’s protocol in ABI PRISM® 7900HT Sequence Detection System. 16S rRNA Cτ values were used for normalisation.
Since NDK activity maintains nucleotide pool, which is crucial for the DNA and RNA syntheses, and cell division, the profile of Msmndk transcripts was determined under conditions of block in dNTP synthesis and cell division, with exponential phase of growth as the control. Inhibition of dNTP synthesis, leading to block in DNA synthesis and cell division, was achieved by exposure of M. smegmatis to hydroxyurea (HU) [23] and phenethyl alcohol (PEA) [24,25] , respectively. The region, which was chosen for the identification of start sites of Msmndk transcripts, was 1791 bp in length, spanning 888 bp of 3’ portion of folC, 486 bp of the hypothetical gene (MSMEG_4628), and 417 bp (complete reading frame) of Msmndk [Fig-1] . The primer extension analyses, carried out on equal quantity of total RNA from the mid-log phase, HU- and PEA-treated samples, identified two transcripts, namely, T1 and T2, under all the three conditions [Fig-1B] . Although a faint primer extension product could be observed above T2, it was not consistent and therefore was not considered for further study. The levels of the primer extension product of T2 seemed to be lower than those of T1 under all the three conditions. This profile gave the clue that the levels of T2 might be lower than that of T1, under the conditions. Although primer extension assay was carried out using identical quantity of total RNA, the levels of primer extension products were not quantitated. Considering the 5’ ends of T1 and T2 to be the true 5’ ends of two different transcripts, the putative (-10) and (-35) sequences were predicted.
T1 originated at C, the 124th nt, upstream of start codon gtg of Msmndk, and was located in the 3’ region of the upstream hypothetical gene, MSMEG_4628 [Fig-1C] . The prediction of -10 and -35 sequences were based on which of the probable sequence closely matched the consensus (for A and B group type of promoters), position of -10 sequence at about 4-8 nt upstream of +1, and -35 sequence at 16-19 nt away from -10 [29] . If a consensus could not be obtained using these parameters, then neighboring sequences were examined for consensus. Based on these criteria, the putative promoter P1, which drives the expression of T1 transcript, was predicted to have probably CAAGCG as the -10 sequence and CGTCTA as the -35 region [Fig-1C] . The spacer region between -10 and -35 region was 15 nt and the -10 sequence was 10 nt upstream of the transcription start site. Similarly, T2 was initiated at A, the 146th nt at 5’ from the start codon of Msmndk, located in the 3’ region of the upstream gene, MSMEG_4628 [Fig-1D] . The corresponding putative promoter, P2, was predicted to possess probably CGTCTA as the -10 element and CCTGGT as the -35 sequence [Fig-1D] . The spacer region between -10 and -35 elements of P2 was 15 nt and the -10 sequence was located at 8 nt upstream of the transcription start site [Fig-1D] .
Based on the consensus documented for a large number of mycobacterial promoters, the P1 and P2 promoters were classified as C group promoters, which do not possess conservation of either -10 or -35 sequence [29;] [Fig-2] .
It was necessary to verify whether the 5' ends identified through primer extension were true 5’ ends or generated through RNA processing. Therefore, activity of the individual putative cloned promoter regions and their (-)10 deletion mutants was determined by quantitating the levels of gfpm2+ mRNA in the M. smegmatis transformants carrying the promoter fusion constructs. The putative P1 and P2 promoter regions could drive expression of gfpm2+ [Fig-3] . The levels of gfpm2+ mRNA from P2 was found to be lower than those from P1. The activity was found abolished in the respective -10 deletion mutants and in the negative control, Ms/pMN406-DPimyc transformant, which was devoid of any promoter. The positive control, Ms/pMN406 transformant, showed maximum levels of gfpm2+ mRNA. These experiments showed that the 5’ ends identified in primer extension assay had originated from true transcription start sites of Msmndk. In addition, the abolition of activity in the -10 deletion mutants established that the predicted putative -10 regions, and hence the corresponding -35 regions, of the putative promoter regions, P1 and P2, were true promoters of the gene.
In order to find out whether the levels of T1 and T2 would be affected under different stress conditions, the levels of expression of gfpm2+ mRNA was quantitated using real time PCR on the total RNA from the promoter fusion transformants {pMN406-DPimyc-P1, pMN406-DPimyc-P2, pMN406-DPimyc-P1-∆(-10), and pMN406-DPimyc-P2-∆(-10)} from mid-log phase, growth-arrested, DNA replication arrested, and nutrient-depleted stationary phase conditions. The levels of gfpm2+ mRNA from P1 did not show reduction during nutrient-depleted stationary phase, and HU- and PEA-treated conditions [Fig-4] .
The present work has identified two Msmndk transcripts, T1 and T2, originating from P1 and P2 promoters, which show features of C group mycobacterial promoters. In concurrence with the primer extension profile, wherein the levels of T2 were less than those of T1, the levels of gfpm2+ mRNA from P2 were less than those from P1. While expression of Msmndk is achieved through two transcripts, Econdk has so far been found to be expressed only from one transcript, wherein the -10 sequence is 56 nts upstream of the Econdk start codon [30] . This is the only other study on the transcriptional analysis of bacterial ndk. Although both T1 and T2 originate from the immediate upstream gene, MSMEG_4628 of unknown function, the possibility of any Msmndk transcript originating from far upstream region cannot be ruled out from the present study. In fact, transcripts originating from far upstream regions expressing mycobacterial genes have been documented in the case of ftsZ of M. smegmatis [25] and ftsE of M. tuberculosis [31] . Such instances have been recorded in other bacterial genera as well, such as an ftsZ transcript originating from the mra promoter, which is 6 kb upstream of the gene in E. coli [32,33] . Similar instances are also known for several genes in Bacillus subtilis [34] , Neisseria gonorrhoeae [35] , Corynebacterium glutamicum [36,37] , Shewanella violacea [38] , and Bartonella bacilliformis and B. henselae [39] .
Examination of the -10 or -35 sequences for the canonical sigma factors in mycobacteria showed only a marginal 33% (2/6 nts) and 16% (1/6 nts) consensus, respectively, for SigA. However, the -10 sequence of P2 (CGTCTA) showed 66% (4/6 nts) consensus with the -10 consensus of M. tuberculosis SigC [CGTS(G/C)S(G/C)S(G/C)] , while the -35 sequence, CCTGGT, showed only 50% consensus with the -35 consensus for SigC [S(G/C)S(G/C)S(G/C)AAT] [Fig-2] [40] . However, SigC is absent in M. smegmatis [41] and therefore regulation of P2 might be by some unknown factor. The M. smegmatis sigE promoter P2 [42] , M. tuberculosis sigH promoter P1 [43] , Mycobacterium bovis BCG sigE promoters, P1 and P2 [42] , tsB promoter of hsp60 [44] and of groEL1 [45] , and the H2O2-inducible P1 promoter of ahpC of Mycobacterium leprae [46] are some of the examples of C group mycobacterial promoters. Many identified mycobacterial promoters often show no match with the consensus of any identified sigma factors of M. tuberculosis [29] . The spacer regions, between -10 and -35 elements of P1 and P2, were 15 nucleotides, which have been found in many known mycobacterial promoter elements [27,29] .
Hydroxyurea reversibly inhibits ribonucleotide reductase, which converts nucleoside monophosphates (NMPs) into deoxynucleoside monophosphates (dNMPs) [23] . Inhibition of the formation of dNMPs results in the depletion of dNTPs, leading to block in DNA synthesis and thereby growth. Exposure to PEA is known to selectively and reversibly inhibit DNA replication [47; unpublished observations in the laboratory] , and thereby cause cell division arrest, without toxicity to the cells. PEA had earlier been used to treat M. smegmatis ATCC 607 [24,25] , Mycobacterium phlei [48] , and M. tuberculosis cells [49] for carrying out nitrosoguanidine mutagenesis to construct genetic map and/or replication map of these mycobacterial species [48,49,50] . In HU- and PEA-treated cells, cell division arrest was indicated by elongated morphology of the cells [Fig-S1] Similarly, nutrient-depleted stationary phase cells, wherein active RNA and DNA syntheses are downregulated, showed decreased levels of NDPs, NTPs (except UTP) and dNTPs [51] . Therefore, perturbation in DNA and RNA syntheses, caused by exposure of cells to HU, PEA, and nutrient-depleted stationary phase, might have a feedback effect on the nucleotide pool, and thereby probably on the requirement for NDK. The levels of NDK might be maintained through T1 and T2, to meet the demands for the synthesis of NTPs and dNTPs for the syntheses of RNA and DNA during active growth phase. The requirement for NTPs and dNTPs, during stress conditions, might be getting mediated through the marginal modulation of the levels of T2. Nevertheless, NDK is nonessential for most bacterial systems, including M. tuberculosis [20] , as other enzymes such as adenylate kinase [52] and polyphosphate kinase [53,54] , which are present in M. smegmatis also (TIGR Database), might be able to synthesise NTPs and dNTPs, as in E. coli [52,53] . Therefore, M. smegmatis may not be entirely dependent on NDK modulation for NTPs and dNTPs and this may probably be the reason for the lack of significant modulation of NDK. Western blot also did not show appreciable changes in the NDK protein levels under the stress conditions (data not shown).
The mycobacterial codon-optimised GFPm2+ has been demonstrated to be more fluorescent than the earlier GFPm+ of high fluorescence, twice more fluorescent than E-GFP, and stable in expression in both slow- and fast-growing mycobacteria [28] . Thus, it offers the advantages of being a sensitive (especially to detect weak promoters), non-invasive, substrate-independent rapid assay system over β-galactosidase [55] , catechol-2, 3-dioxygenase [56] , chloramphenicol acetyl transferase [57] , and bacterial luciferase [58] . However, since GFP protein is stable, the intensity of expressed GFPm2+ was not used for quantitation of promoter activity. Rather, it was used only to rapidly check qualitatively for the activity of the cloned putative promoter regions in the trans-formants, using fluorescence microscopy, and flow cytometry [Fig-S1] [Fig-S2] [Fig-S3] [Fig-S4] [Fig-S5] [Fig-S6] , as performed earlier in our laboratory [26] .
Therefore, for the accurate determination of the activity of the putative promoters, quantitative RT-PCR of the gfpm2+ mRNA was used. The visibly lower levels of T2, as compared to that of T1, observed in primer extension assay on equal quantity of total RNA from the different growth or stress conditions were in concurrence with the lower levels of gfpm2+ mRNA from P2. Decreased levels of gfpm2+ mRNA from P2, as compared to those from P1, in the cells under nutrient-depleted stationary phase indicated that both T1 and T2 would be present in these cells, like under other stress conditions. Therefore, primer extension assay was not performed on the RNA from this condition. Identification of Msmndk transcripts and the modulation in their levels under different stress conditions will enable study of the regulation of Msmndk in the metabolic circuits in mycobacteria.
The work was supported by a research grant from CSIR [37 (1533)/12/EMR-II] and in part by a part-grant of DBT-supported Centre of Excellence in Tuberculosis to PA. The infrastructural facilities provided by the DBT Programme Support in Pathogen Biology to IISc, DBT-supported FACS facility, UGC-CAS and DST-FIST support to the MCB Dep’t., IISc, are acknowledged. Dr. Omana Joy is gratefully acknowledged for technical support in flow cytometry analysis. MA was a CSIR SRF.
[1] Krebs H.A. and Hems R. (1953) Biochimica et Biophysica Acta, 1(1-2), 172-l80.
» CrossRef » Google Scholar » PubMed » DOAJ » CAS » Scopus
[2] Berg P. and Joklik W.K. (1953) Nature, 172(4387), 1008-1009.
» CrossRef » Google Scholar » PubMed » DOAJ » CAS » Scopus
[3] Parks R.E. and Agarwal R.P. (1973) Nucleoside diphosphonases, The enzyme, 307-333.
» CrossRef » Google Scholar » PubMed » DOAJ » CAS » Scopus
[4] Chakrabarty A.M. (1998) Molecular Microbiology, 28(5), 875-882.
» CrossRef » Google Scholar » PubMed » DOAJ » CAS » Scopus
[5] Bernard M.A., Ray N.B., Olcott M.C., Hendricks S.P., and Mathews C.K. (2000) Journal of Bioenergetics and Biomembrane, 32(3), 259-267.
» CrossRef » Google Scholar » PubMed » DOAJ » CAS » Scopus
[6] Postel E.H. (2003) Journal of Bioenergetics and Biomembrane, 35(1), 31-40.
» CrossRef » Google Scholar » PubMed » DOAJ » CAS » Scopus
[7] Liu X. and De Wulf P. (2004) Journal of Biological Chemistry, 279(13), 12588-12597.
» CrossRef » Google Scholar » PubMed » DOAJ » CAS » Scopus
[8] Beyhan S., Tischler A.D., Camilli A. and Yildiz F.H. (2006) Infection and Immunity, 74(6), 3633-3642.
» CrossRef » Google Scholar » PubMed » DOAJ » CAS » Scopus
[9] Nicholson T.L., Olinger L., Chong K., Schoolnik G. and Stephens R.S. (2004) Journal of Bacteriology, 185(10), 3179-3189.
» CrossRef » Google Scholar » PubMed » DOAJ » CAS » Scopus
[10] Oberto J., Nabti S., Jooste V., Mignot H. and Rouviere-Yaniv J. (2009) PLoS One 4, e4367.
» CrossRef » Google Scholar » PubMed » DOAJ » CAS » Scopus
[11] Kang Y., Weber K.D, Qiu Y., Kiley P.J. and Blattner F.R. (2005) Journal of Bacteriology, 187(3), 1135-1160.
» CrossRef » Google Scholar » PubMed » DOAJ » CAS » Scopus
[12] Zheng D., Constantinidou C., Hobman J.L. and Minchin S.D. (2004) Nucleic Acids Research, 32(19), 5874-5893.
» CrossRef » Google Scholar » PubMed » DOAJ » CAS » Scopus
[13] Kelly A., Goldberg M.D., Carroll R.K., Danino V., Hinton J.C.D. and Dorman C.J. (2004) Microbiology, 150(7), 2037-2053.
» CrossRef » Google Scholar » PubMed » DOAJ » CAS » Scopus
[14] Konyecsni W.M. and Deretic V. (1990) Journal of Bacteriology, 172(5), 2511-2520.
» CrossRef » Google Scholar » PubMed » DOAJ » CAS » Scopus
[15] Schlictman D., Kavanaugh-Black A., Shankar S. and Chakrabarty A.M. (1994) Journal of Bacteriology, 176(19), 6023-6029.
» CrossRef » Google Scholar » PubMed » DOAJ » CAS » Scopus
[16] Kim H.Y., Schlictman D., Shankar S., Xie Z., Chakrabarty A.M. and Kornberg A. (1998) Molecular Microbiology, 27(4), 717-725.
» CrossRef » Google Scholar » PubMed » DOAJ » CAS » Scopus
[17] Santos M. R., Cosme A.M., Becker J.D., Medeiros J.M.C., Mata M.F. and Moreira L.M. (2010) BMC Microbiology, 10, 180.
» CrossRef » Google Scholar » PubMed » DOAJ » CAS » Scopus
[18] Lu Q., Zhang X., Almaula N., Mathews C.K. and Inouye M. (1995)Journal of Molecular Biology, 254(3), 337-341.
» CrossRef » Google Scholar » PubMed » DOAJ » CAS » Scopus
[19] Munoz-Dorado J., Inouye M. and Inouye S. (1990) Journal of Biological Chemistry, 265(5), 2702-2706.
» CrossRef » Google Scholar » PubMed » DOAJ » CAS » Scopus
[20] Sassetti C.M., Boyd D.H. and Rubin E.J. (2003) Molecular Microbiology, 48(1), 77-84.
» CrossRef » Google Scholar » PubMed » DOAJ » CAS » Scopus
[21] Arumugam M. (2010) Doctoral Thesis. Indian Institute of Science, Bangalore, India.
» CrossRef » Google Scholar » PubMed » DOAJ » CAS » Scopus
[22] Tiwari S., K.V.R. Kishan T. Chakrabarti P.K. and Chakraborti. (2004) Journal of Biological Chemistry, 279(42), 43595-43603.
» CrossRef » Google Scholar » PubMed » DOAJ » CAS » Scopus
[23] Winder F.G. and Barber D.S. (1973) Journal of General Microbiology, 76(1), 189-196.
» CrossRef » Google Scholar » PubMed » DOAJ » CAS » Scopus
[24] Mizuguchi Y. (1970) Medicine and Biology, 81(5), 215-220.
» CrossRef » Google Scholar » PubMed » DOAJ » CAS » Scopus
[25] Roy S., Anand D., Vijay S., Gupta P. and Ajitkumar P. (2011) The Open Journal of Microbiology, 5, 43-53.
» CrossRef » Google Scholar » PubMed » DOAJ » CAS » Scopus
[26] Roy S., Mir M.A., Anand S.P., Niederweis M. and Ajit kumar P. (2004) Research in Microbiology, 155(10), 817-826.
» CrossRef » Google Scholar » PubMed » DOAJ » CAS » Scopus
[27] Roy S. and Ajitkumar P. (2005) Journal of Bacteriology, 187(7), 2540-2550.
» CrossRef » Google Scholar » PubMed » DOAJ » CAS » Scopus
[28] Steinhauer K., Eschenbacher I., Radischat N., Detsch C., Niederweis M. and Goroncy-Bermes P. (2010) Applied and Environmental Microbiology, 76(2), 546-554.
» CrossRef » Google Scholar » PubMed » DOAJ » CAS » Scopus
[29] Gomez M. and Smith I. (2000) Molecular Genetics of Mycobacteria, 111-122.
» CrossRef » Google Scholar » PubMed » DOAJ » CAS » Scopus
[30] Hama H., Almaula N., Lerner C., Inouye M. and Inouye S. (1991) Gene, 105(1), 31-36.
» CrossRef » Google Scholar » PubMed » DOAJ » CAS » Scopus
[31] Roy S., Vijay S., Arumugam M., Anand D., Mir M.A. and Ajitkumar P. (2011) Current Microbiology, 62(5), 1581-1589.
» CrossRef » Google Scholar » PubMed » DOAJ » CAS » Scopus
[32] Flardh K., Palacios P. and Vicente M. (1998) Molecular Microbiology, 30(2), 305-315.
» CrossRef » Google Scholar » PubMed » DOAJ » CAS » Scopus
[33] Mengin-Lecreulx D., Ayala J., Bouhss A., van Heijenoort J., Parquet C. and Hara H. (1998) Journal of Bacteriology, 180(17), 4406-4412.
» CrossRef » Google Scholar » PubMed » DOAJ » CAS » Scopus
[34] Gholamhoseinian A., Shen Z., Wu J.J., Piggot P. (1992) Journal of Bacteriology, 174(14), 4647-4656.
» CrossRef » Google Scholar » PubMed » DOAJ » CAS » Scopus
[35] Francis F., Ramirez-Arcos S., Salimnia H., Victor C. and Dillon J.R. (2000) Gene, 251(2), 141-151.
» CrossRef » Google Scholar » PubMed » DOAJ » CAS » Scopus
[36] Ramos A., Honrubia M.P. and Vega D. (2004) Research in Microbiology, 155(3), 174-184.
» CrossRef » Google Scholar » PubMed » DOAJ » CAS » Scopus
[37] Letek M., Ordonez E., Fiuza M., Honrubia-Marcos P., Vaquera J., Gil J.A. and Mateos L.M. (2007) International Microbiology, 10(4), 271-282.
» CrossRef » Google Scholar » PubMed » DOAJ » CAS » Scopus
[38] Ishii A., Nakasone K., Sato T., Wachi M., Sugai M., Nagai K. and Kato C. (2002) Journal of Biochemistry, 132(2), 183-188.
» CrossRef » Google Scholar » PubMed » DOAJ » CAS » Scopus
[39] Fiskus W., Padmalayam I., Kelly T., Guibao C. and Baumstark B.R. (2003) DNA Cell Biology, 22(11), 743-752.
» CrossRef » Google Scholar » PubMed » DOAJ » CAS » Scopus
[40] Sun R., Converse P.J., Ko C., Tyagi S., Morrison N.E. and Bishai W.R. (2004) Molecular Microbiology, 52(1), 25-38.
» CrossRef » Google Scholar » PubMed » DOAJ » CAS » Scopus
[41] Manganelli R., Proveddi R., Rodrigue S., Beaucher J., Gaudreau L. and Smith I. (2004) Journal of Bacteriology, 186(4), 895-902.
» CrossRef » Google Scholar » PubMed » DOAJ » CAS » Scopus
[42] Wu Q.L., Kong D., Lam K. and Husson R.N. (1997) Journal of Bacteriology, 179(9), 2922-2929.
» CrossRef » Google Scholar » PubMed » DOAJ » CAS » Scopus
[43] Fernandes N.D., Wu Q.L., Kong D., Puyang X., Garg S. and Husson R.N. (1999) Journal of Bacteriology, 181(14), 4266-4274.
» CrossRef » Google Scholar » PubMed » DOAJ » CAS » Scopus
[44] Stover C.K., de la Cruz V.F. and Fuerst T.R. (1991) Nature, 351(6326), 456-460.
» CrossRef » Google Scholar » PubMed » DOAJ » CAS » Scopus
[45] Kong T.H., Coates A.R., Butcher P.D., Hickman C.J. and Shinnick T.M. (1993) Proceedings of National Academy of Science, USA, 90(7), 2608-2612.
» CrossRef » Google Scholar » PubMed » DOAJ » CAS » Scopus
[46] Dhandayuthapani S., Mudd M. and Deretic V. (1997) Journal of Bacteriology, 179(7), 2401-2409.
» CrossRef » Google Scholar » PubMed » DOAJ » CAS » Scopus
[47] Berrah G. and Konetzka A.W. (1962) Journal of Bacteriology, 83(4), 738-744.
» CrossRef » Google Scholar » PubMed » DOAJ » CAS » Scopus
[48] Konicek J. and Konickova-Radochova M. (1978) Folia Microbiologia, 23(4), 261-271.
» CrossRef » Google Scholar » PubMed » DOAJ » CAS » Scopus
[49] Woodley L.C., Baldwin N.J. and Greenberg J. (1981) Journal of Bacteriology, 147(1), 176-180.
» CrossRef » Google Scholar » PubMed » DOAJ » CAS » Scopus
[50] Mizuguchi Y. (1970) Medicine and Biology, 81(5), 243-247.
» CrossRef » Google Scholar » PubMed » DOAJ » CAS » Scopus
[51] Buckstein M.H., He J. and Rubin H. (2008) Journal of Bacteriology, 190(2), 718-726.
» CrossRef » Google Scholar » PubMed » DOAJ » CAS » Scopus
[52] Lu Q. and Inouye M. (1996) Proceedings of National Academy of Science, USA, 93(12), 5720-5725.
» CrossRef » Google Scholar » PubMed » DOAJ » CAS » Scopus
[53] Ishige K., Zhang H. and Kornberg A. (2002) Proceedings of National Academy of Science, USA, 99(26), 16684-16688.
» CrossRef » Google Scholar » PubMed » DOAJ » CAS » Scopus
[54] Sureka K., Sanyal S., Basu J. and Kundu M. (2009) Molecular Microbiology, 74(5), 1187-1197.
» CrossRef » Google Scholar » PubMed » DOAJ » CAS » Scopus
[55] Rowland B., Purkayastha A., Monserrat C., Casart Y., Takiff H. and McDonough K.A. (1999) FEMS Microbiology Letters, 179(2), 317-325.
» CrossRef » Google Scholar » PubMed » DOAJ » CAS » Scopus
[56] Curcic R., Dhandayuthapani S. and Deretic V. (1994) Molecular Microbiology, 13(6), 1057-1064.
» CrossRef » Google Scholar » PubMed » DOAJ » CAS » Scopus
[57] DasGupta S.K., Bashyam M.D. and Tyagi A.K. (1993) Journal of Bacteriology, 175(16), 5186-5192.
» CrossRef » Google Scholar » PubMed » DOAJ » CAS » Scopus
[58] Roberts E.A., Clark A. and Friedman R.L. (2005) FEMS Microbiology Letters, 243(1), 243-249.
» CrossRef » Google Scholar » PubMed » DOAJ » CAS » Scopus
 | Fig. 1- (A) The region upstream of Msmndk used in primer extension assay. The 417 bp of Msmndk, the 486 bp of the immediate upstream gene, MSMEG_4628, and the 3’ 888 bp of the next upstream gene, folC, are shown. The small vertical lines indicate the boundaries between the genes. Arrow indicates the position of the reverse primer, which was used for extension into the upstream region of Msmndk. (B) Primer extension gel for Msmndk transcripts, from mid-log phase (M), HU-treated (HU), and PEA-treated (PEA) cells. (C) The map of transcription start site (TSS), C, of T1 transcript, the respective -10 and -35 sequences (bold and underlined) of P1 promoter. (D) The map of transcription start site (TSS), A, of T2 transcript, the respective -10 and -35 sequences (bold and underlined) of P2 promoter. The start codon gtg and the TSS are shown in bold letters. CTAG indicates the sequence ladder. |
 | Fig. 2- Comparison of Msmndk P1 and P2 promoter sequences with the -10 and -35 consensus sequences of A, B, C, and D group of mycobacterial promoters [29]. Canonical sigma factor consensus sequences are shown for comparison [41]. The spacer region between -10 and -35 elements and the TSS (‘C’ for P1 and ‘A’ for P2) are tabulated for Msmndk P1 and P2 promoters. Nucleotide notations: W= a/t; S= g/c; M= a/c; R= a/g. |
 | Fig. 3- Profile of the relative levels of expression of gfpm2+ mRNA from the putative promoter regions, P1 and P2, using the respective wild type and -10 deletion mutants. pMN406 (with Pimyc promoter) and pMN406-ΔPimyc (devoid of Pimyc) are the positive and negative controls. Relative activity with respect to that of Ms cells was plotted. |
 | Fig. 4- Profile of the relative levels of expression of gfpm2+ mRNA from the putative promoter regions, P1 and P2 and their respective -10 deletion mutants under mid-log phase (Mid-log), nutrient-depleted stationary phase (StPh), hydroxyurea-treated (HU), PEA-treated (PEA) conditions. Relative activity with respect to that of pMN406 was plotted. |
 | Fig. S1- Microscopic images of elongated morphology of Mycobacterium smegmatis cells treated with phenethyl alcohol (PEA) and hydroxy urea (HU), indicative of cell division arrest. |
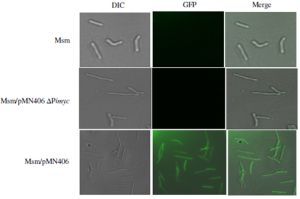 | Fig. S2- GFPm2+ fluorescence microscopy images of M. smegmatis transformants. Msm, untransformed cells. Msm/pMN406-ΔPimyc, negative control. Msm/pMN406, positive control. |
 | Fig. S3- GFPm2+ fluorescence microscopy images of M. smegmatis transformants. Left panel: GFPm2+ expression from: (A) P1 and (B) P2 at mid-log phase; (C) P1 and (D) P2 in HU-treated; and (E) P1 and (F) P2 in PEA-treated cells. Right panel: GFPm2+ expression from the (-) 10 deletion mutants of: (G) P1 and (H) P2 at mid-log phase; (I) P1and (J) P2 in HU-treated; and (K) P1 and (L) P2 in PEA-treated cells. |
 | Fig. S4- Flow cytometry profile and the extent of expression of GFPm2+ in mid-log phase M. smegmatis transformants: Flow cytometry profile: (A) Ms cells (dark shade), pMN406 (light shade). (B) pMN406-ΔPimyc (grey shade), pMN406-ΔPimyc-P1 (light shade). (C) pMN406-ΔPimyc (grey shade), pMN406-ΔPimyc-P2 (light shade). Bar graph: Extent of expression of GFPm2+. |
 | Fig. S5- Flow cytometry profile and the extent of expression of GFPm2+ in HU-treated M. smegmatis transformants: Flow cytometry profle: (A) pMN406-ΔPimyc (grey shade), pMN406-ΔPimyc-P1 (light shade). (B) pMN406-ΔPimyc (grey shade), pMN406-ΔPimyc-P2 (light shade). Bar graph: Extent of expression of GFPm2+. |
 | Fig. S6- Flow cytometry profile and the extent of expression of GFPm2+ in PEA-treated M. smegmatis transformants: Flow cytometry profile: (A) pMN406-ΔPimyc (dark shade), pMN406-ΔPimyc-P1 (light shade). (B) pMN406-ΔPimyc (dark shade), pMN406-ΔPimyc-P2 (light shade). Bar graph: Extent of expression of GFPm2+. |
 | Table 1- |