ISSN : 0975-2927
EISSN : 0975-9166

HIREMATH P.S.1, PARASHURAM BANNIGIDAD2*, MANJUNATH HIREMATH3
1Department of Computer Science, Gulbarga University, Gulbarga-06, Karnataka, India
2Department of Computer Science, Govt. Degree College, Gulbarga-05, Karnataka, India
3Department of Computer Science, Gulbarga University, Gulbarga-06, Karnataka, India
* Corresponding Author : parashurambannigidad@gmail.com
Received : 06-11-2011 Accepted : 09-11-2011 Published : 12-12-2011
Volume : 3 Issue : 4 Pages : 180 - 184
Int J Mach Intell 3.4 (2011):180-184
DOI : http://dx.doi.org/10.9735/0975-2927.3.4.180-184
Conflict of Interest : None declared
Accurate and reliable segmentation is an essential step in determining valuable quantitative information on size, shape and texture, which may assist microbiologists in their diagnoses. The snakes or active contours are used extensively in computer vision and image processing applications, particularly to locate object boundaries. The objective of the present study is to develop an automatic tool to identify and classify the virus particles in digital microscopic images using multigrid active contour model. Geometric features are used to identify the different types of virus particles, namely, Rotavirus and Adenovirus using 3ï³ï€ classifier, K-NN classifier and Neural Network classifiers. The current methods rely on the subjective reading of profiles by a human expert based on the various manual staining methods. In this paper, we propose a method for virus particle classification by segmenting digital microscopic virus images and extracting geometric features for virus particle classification. The experimental results are compared with the manual results obtained by the microbiology expert and demonstrate the efficacy of the proposed method.
Rotavirus, Adenovirus, Image segmentation, Image analysis, Active contour multigrid model, 3 σ classifier, K-NN classifier, Neural network classifier.
A virus is an infectious agent too small to be seen directly with a light microscope. They are not made of cells and can only replicate inside the cells of another organism (the viruses' host). Rotavirus is a genus of double-stranded RNA virus in the family Reoviridae. It is the leading single cause of severe diarrhoea among infants and young children, and is one of several viruses that cause infections commonly known as stomach flu, despite having no relation to influenza. By the age of five, nearly every child in the world has been infected with Rotavirus at least once. Adenoviruses are medium-sized (90–100 nm),non-enveloped (without an outer lipid bilayer) icosahedral viruses composed of a nucleo -capsid and a double-stranded linear DNA genome. Viruses of the Adenoviridae family infect various species of vertebrates, including humans. Adenoviruses were first isolated in 1953 from human adenoids. They are classified as group I under the Baltimore classification scheme, meaning their genomes consist of double stranded DNA [2,3] .
The snakes or active contours, are used extensively in computer vision and image processing applications, particularly to locate object boundaries. Nonparametric algorithms can generally be categorized as region-based, edge-based, histogram-based, clustering and neural network based algorithms. The data used for development of the algorithm consist of Rotavirus particle images acquired from child faeces of an infected child and Adenovirus particles from human adenoids by the Transmission Electron Microscope [13,14,15] is shown in the [Fig-1] .
Some of the research works have been carried out by different authors in the literature. The segmentation and statistical analysis of individual Rotavirus particles has been carried out by Venkataraman, et al. [4] Active contours without edges based on Mumford-Shah segmentation techniques and the level set method has been proposed by Tony F. Chan [5] . The object identification by using snakes, shapes and gradient vector flow has been investigated by Chenyang Xu and Jerry [6] . Edge segmentation and feature extraction using snakes active contour models has been done by Michaels Kass [7] . Multigrid geometric active contour models for segmenting and tracking object in image analysis and computer vision has been proposed by George Papandreou and Petros Maragos [9] . Segmentation and identification of Rotavirus-A in digital microscopic images using active contour models has been carried out by Hiremath et al. [11] . The automated method for Malaria parasite detection using microscope color image, based on the color image processing using HSI model, has been proposed by Koppar and Sridhar [16] .
In this paper, the objective is to propose a method for automatic identification and classification of virus particles in digital microscopic images using multigrid active contour model. Geometric features are used to identify the virus particles, namely, Rotavirus and Adenovirus using 3 σ classifier, K-NN classifier and Neural Network classifier. The experimental results are compared with the manual results obtained by microbiological expert and demonstrate the efficacy of the proposed method.
Rotavirus and Adenovirus particle images on Transmission Electron Microscopy are acquired by using different types of staining methods. Negative staining is an established method, often used in diagnostic microscopy, for contrasting a thin specimen with an optically opaque fluid. For bright field microscopy, negative staining is typically performed using a black ink fluid such as nigrosin. The specimen, such as a wet bacterial culture spread on a glass slide, is mixed with the negative stain and allowed to dry. When viewed with the microscope the virus particles, and perhaps their spores, appear light against the dark surrounding background. Acquisition of virus particle images is usually done using a CCD camera mounted in the optical path of the microscope. Very often, very high resolution cameras are employed to gain as much direct information as possible. Often digital cameras used for this application provide pixel intensity data to a resolution of 12-16 bits. We have considered 100 color images of both Rotavirus and Adenovirus particles (non-overlapping) x 92,000 (80kv, 200nm) magnification for present study and these are converted into grayscale images [2,3] .
Snakes or active contours are curves defined within an image domain that can move under the influence of internal forces coming from within the curve itself and external forces computed from the image data. The internal and external forces are defined so that the snake will conform to an object boundary or other desired features within an image. Snakes provide a unified account of a number of visual problems, including detection of edges, lines, and subjective contours; motion tracking; and stereo matching [8,10] .
Multigrid active contour techniques overcome the typically slow convergence properties of conventional uni-grid iterative methods. While uni-grid relaxation procedures are particularly effective at eliminating the high spatial frequency part of error, they suppress very slowly its low-frequency part. This behavior stems from the local nature of computations in uni-grid methods, which allows attenuation of error components that vary on scales comparable to the discretization mesh grid size h, but prevents quick suppression of larger scale errors. As discretization grids get finer, information propagates even more slowly and the local effects of uni-grid methods become more pronounced. Multigrid cycles overcome these difficulties by employing conventional relaxation procedures, called smoothers in multigrid terminology, in a hierarchy of grids. The purpose of the automated image analysis of digital virus particle image is to identify the type of virus, whether it is Rotavirus or Adenovirus based on their geometric features using different classification techniques, namely, 3 σ classifier, K-NN classifier and Neural Network classifier.
Out of many geometric features used by various authors in the literature [12] , it is observed that there are six geometric features, namely, perimeter, roundness, compactness, eccentricity, tortuosity and length-width ratio, which provide better classification results.
The virus images generally contain noise, small debris and artifacts depending on the different staining methods. To remove this debris, we have preprocessed the image by applying morphological operations, namely, erosion, reconstruction and dilation. This stage is of high importance in achieving good results in segmentation and further process. The gray scale virus image is segmented using the multigrid geometric active contour model upto N iterations to obtain segmented image, where N is the number of iterations required for the snake curve to reach the object boundary and does not move thereafter, which yields binary image. After labeling the segmented image, the geometric features xi, i=1,2,..,6, are extracted for each labeled segment. These features are used as a basis for the particle classification. Using the training set of images (with known particle classification), for each feature , of kth particle type, we compute the mean
and standard deviation
of the sampling distribution of the feature values and store them as knowledge base. In the testing phase, for a given test image, feature values
of the segmented regions (virus particle) are computed and then virus particle classification is done using the 3 σ rule, namely: For a segmented region in the test image, if the feature values
lie in the interval
, i=1,2,.., 6, then the region is a particle of type k. The k=1, 2 correspond to Rotavirus or Adenovirus, respectively.
The K-nearest neighbor (K-NN) classification is performed by using a reference data set (training set) which contains both the input (feature set) and the target variables (known particles) and then by comparing the unknown (test data) which contains only the input variables (features) to that reference set. The distance of the unknown to the K nearest neighbors determines its class assignment by either averaging the class numbers of the K nearest reference points or by obtaining a majority vote from them.
The input layer has 2 neurons and 6 shape features as inputs, and output layer has two outputs (Rotavirus and Adenovirus). The transfer function used is ‘tan sigmoidal’, training function used is Levenberg-Marquardt back propagation, the weight/bias learning function is ‘gradiant descent’ function and the performance function is ‘mean square error (mse)’ which is set to 0.01. In the case of radial basis neural network, the shape features are used as inputs. The error function is ‘mean square error (mse)’ which is set to 0.15. The spread for radial basis function is 1.0 and the maximum number of neurons allowed to add during training is 300 [12] .
The proposed method for the identification and classification of virus particles based on their geometric features is given below:
Algorithm 1: Extraction of features for knowledge base.
Step 1: Input virus particle image (RGB color training image).
Step 2: Convert the RGB image into gray scale image.
Step 3: Perform multigrid geometric active contour.
model upto N iterations to obtain segmented image, where N is the number of iterations required for the snake curve to reach the object boundary and does not move thereafter.
Step 4: After removing border touching particles, perform labeling the segmented image.
Step 5: For each labeled segment, compute geometric.
shape features xi, i=1,2,..,6, (i.e. perimeter, roundness, eccentricity, compactness, tortuosity and length-width ratio) for each particle type k. The k=1, 2, Rotavirus and Adenovirus, respectively.
Step 6: Repeat steps 1 to 5 for all the training images.
Step 7: Compute mean and standard deviation
of the sampling distribution of the feature values for each particle type k and store them as knowledge base.
Algorithm 2: Classification of virusparticles.
Step 1: Input virus image (RGB color test image).
Step 2: Convert the RGB image into gray scale image.
Step 3: Perform multigrid geometric active contour.
model upto N iterations to obtain segmented image, where N is the number of iterations required for the snake curve to reach the object boundary and does not move thereafter.
Step 4: After removing border touching particles, perform labeling the segmented image.
Step 5: For each labeled segment, compute geometric shape features xi, i=1,2,..,6, (i.e. perimeter, roundness, eccentricity, compactness, tortuosity and length-width ratio) and store these features as .
Step 6: Apply 3 σ rule for classification of the bacterial particles: A segmented region is of particle type k, if its features lie in the interval
, i=1,2,..,6. The k=1,2 correspond to Rotavirus and Adenovirus, respectively.
Step 7: Repeat the Steps 5 and 6 for all labeled segments and output the classification of identified particles.
The value of N, the number of iterations, is empirically determined and depends upon the image set in general. For the experimental data set considered in the present study, N is found to be 300.The above algorithm for classification phase can be modified to apply K-NN classifier and Neural Network classifier to the feature set in the Step 6 and the classification performance of the different classifiers can be compared. The K-NN classifier with K=1 is the minimum distance classifier.
For the purpose of experimentation, 100 colour digital images of virus particles (non-overlapping), of each type, with x92,000 (80kv, 200nm) magnification are considered and these are taken from transmission electron microscopy. The implementation is done on an Intel core 2 quad processor @ 2.83 GHz machine using MATLAB 7.9. In the training phase, each input colour virus particle image [Fig-2] (a) is converted into grayscale and adjusted the image intensity values. The resultant image is segmented using multigrid active contour model initiated by multigrid circular masks [Fig-2] (b) on whole image [Fig-2] (c) to obtain binary image [Fig-2] (d). Then, the segmented image is labeled and for each segmented region (known particles), the geometric features are extracted.
The mean and standard deviation of the sampling distribution of these features obtained from the training images are stored in the knowledge base of the Rotavirus and Adenovirus particles, as shown in the [Table-1] . Sample training images of both the virus particles are shown in [Fig-3] . In the testing phase, for a test image, the feature extraction algorithm is applied and the test feature values for each segmented region are used for classification using 3 σ rule, K-NN classifier and Neural Network classifier. The [Fig-4] shows some sample test images used for classification of virus particles. The [Table-2] summarizes the average classification rates obtained by different classification techniques. For test images, the 3 σ classifier has yielded an accuracy in the range of 95.6% to 96%, K-NN classifier has yielded 97% to 98.33% for K=1 (i.e. minimum distance classifier), and has yielded 98% to 98.79% in K=5. The neural network classifier has yielded in the range of 98.52 to 98.98% accuracy. The performance comparison indicates that the neural network classifier has good classification ability. The classification results for detection of Rotavirus and Adenovirus particles are given in the [Table-3] .
In this paper, we have proposed a method for segmentation and classification of Rotavirus and Adenovirus particles in transmission electron microscope images using multigrid active contour model. The geometric feature values of virus particles are considered. The experimental results are confirmed by visual inspection conducted by microbiological experts. The proposed method is more reliable and computationally less expensive, the 3 σ classifier has yielded an accuracy in the range of 95.6% to 96%, K-NN classifier has yielded 97% to 98.33% for K=1 (i.e. minimum distance classifier), and has yielded 98% to 98.79% in K=5. The neural network classifier has yielded in the range of 98.52 to 98.98% accuracy. The performance comparison indicates that the neural network has good classification ability. It could be improved further by better pre-processing methods, feature sets and classifiers. The proposed method may be used for identification and classification of other virus particles, namely, H1N1, Influenza, Polio, and Malaria etc., which will be considered in our future work.
The authors are grateful to the referees for their valuable comments and suggestions. Further, the authors are indebted to Dr. A. Dayanand, Professor of Microbiology, Gulbarga University, Gulbarga, and Dr. Ramakrishna, Department of Microbiology, Government Degree College, Gulbarga for providing images and manual results of the Rotavirus and Adenovirus images by visual inspection. This research work is financially supported under UGC Minor Research Project (No. MRP(S)-715/2010-11/KAGU009/UGC-SWRO).
[1] Rafel C. Gonzalez and Richard E. Woods, (2002).
» CrossRef » Google Scholar » PubMed » DOAJ » CAS » Scopus
[2] Hayat M. A., (2000) Cambridge University Press. pp. 45-61. ISBN 0521632870.
» CrossRef » Google Scholar » PubMed » DOAJ » CAS » Scopus
[3] Bozzola John J., Russell Lonnie D. (1999) pp. 21–31. ISBN 9780763701925.
» CrossRef » Google Scholar » PubMed » DOAJ » CAS » Scopus
[4] Venkataraman S., Allison D.P., Qi H., Morrell-Falvey J.L., Kallewaard N.L., Crowe Jr. J.E. and Doktycz M.J. (2006) Ultramicroscopy, Elsevier, Vol. 106, pp. 829-837.
» CrossRef » Google Scholar » PubMed » DOAJ » CAS » Scopus
[5] Tony F Chan, Luminita A. Vese, (2001) IEEE Transaction on Image Processing, Vol. 10, No. 2, pp. 266-277.
» CrossRef » Google Scholar » PubMed » DOAJ » CAS » Scopus
[6] Chenyang Xu, Jerry L Prince (1998) IEEE Transactions on Image Processing, Vol. 7, No. 3, pp. 359-369.
» CrossRef » Google Scholar » PubMed » DOAJ » CAS » Scopus
[7] Michael Kass, Andrew Witkin and Demetri (1998) Intl. J. of Computer Vision, pp. 321-331.
» CrossRef » Google Scholar » PubMed » DOAJ » CAS » Scopus
[8] Osher S. and Sethian J.A. (1988) J. Compact Phy, Vol. 79, pp. 12-49.
» CrossRef » Google Scholar » PubMed » DOAJ » CAS » Scopus
[9] George Papandreou and Petros Maragos (2007) IEEE Transactions on Image Processing, Vol., 16, No XX, pp. 229-240.
» CrossRef » Google Scholar » PubMed » DOAJ » CAS » Scopus
[10] Caselles V., Kimmel R. and Sapiro G. (1997) Int’l J. Comp. Vision, Vol. 22 No.1, pp. 61-69.
» CrossRef » Google Scholar » PubMed » DOAJ » CAS » Scopus
[11] Hiremath P.S., Parashuram Bannigidad, Manjunath Hiremath (2010) International Conference on Contours of Computing Technology (Think Quest - 2010), pp. 192-196.
» CrossRef » Google Scholar » PubMed » DOAJ » CAS » Scopus
[12] Hiremath P.S., Parashuram Bannigidad (2011) I. J. Computational Biology and Drug Design, Vol. 4(3), pp. 262-273.
» CrossRef » Google Scholar » PubMed » DOAJ » CAS » Scopus
[13] http://en.wikipedia.org/wiki/Adenoviridae.
» CrossRef » Google Scholar » PubMed » DOAJ » CAS » Scopus
[14] http://www.amtimaging.com/www11/english/gallery_e.html
» CrossRef » Google Scholar » PubMed » DOAJ » CAS » Scopus
[15] http://www.med.upenn.edu/gtp/morphology_gallery.shtml
» CrossRef » Google Scholar » PubMed » DOAJ » CAS » Scopus
[16] Anant R. Koppa and Venugopalachar Sridhar, Malaria Parasite Detection (2011) International Journal of E-Health and Medical Communications, Vol. 2(2), pp. 68-81.
» CrossRef » Google Scholar » PubMed » DOAJ » CAS » Scopus
 | Fig. 1- TEM images (a) Rotavirus particle (b) Adenovirus particle |
 | Fig. 2- (a) Original Virus TEM images, (b) Initializing circular multigrid, (c) Image shown after 300 iterations, (d) Active contour multigrid segmentation |
 | Fig. 3- Sample training images (a) Rotavirus and (b) Adenovirus particles |
 | Fig 4- Sample test images; (a) Rotavirus particle; (b) Adenovirus particles |
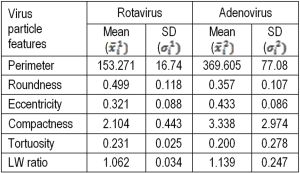 | Table 1- Mean and standard deviation of geometric features of virus particles of types: Rotavirus and Adenovirus |
 | Table 2- Average classification rates obtained by different classification techniques |
 | Table 3- Classification results for detection of Rotavirus and Adenovirus particles |