ISSN : 0975-2927
EISSN : 0975-9166

BASAVARAJ HIREMATH1*, SRINIVAS HALVI2, SHIVANAND S GORNALE3
1Department of Medical Electronics, Dayananda sagar college of Engineering, Bangalore, India
2Department of Medical Electronics, Dayananda sagar college of Engineering, Bangalore, India
3Department of Computer Science, Government College, Mandya, India
* Corresponding Author : bvhiremath@rediffmail.com
Received : 29-09-2011 Accepted : 03-11-2011 Published : 07-11-2011
Volume : 3 Issue : 3 Pages : 126 - 129
Int J Mach Intell 3.3 (2011):126-129
DOI : http://dx.doi.org/10.9735/0975-2927.3.3.126-129
Conflict of Interest : None declared
Road accidents are a major factor for deaths world wide and recent studies show that driver fatigue is a key factor for road accidents. Drivers tend to drive vehicles even if they are extremely tired and due to this, there is chance of them falling asleep at the wheel which results in accidents causing major loss to precious human life & property. This implies there is a need for a driver alert system which monitors the driver’s wakefulness and gives an alarm. This paper proposes a novel technique to determine sleep stages by considering the available EEG Signals of the subject, calculate its FFT and determine the power spectrum. Using this we then plot the hypnogram from which the wakefulness and sleep stages can be determined and if the driver is found to move from a state of wakefulness to sleep stage, immediately an alarm is provided. This concept can be enhanced for real time application with hardware realization and thus helps to reduce road accidents to a great extent.
Hypnogram, FFT, EEG, power spectrum.
Despite increased automation, many critical aspects of our lives depend on operator control. As we drive more comfortable cars longer distances and run systems with 3 shifts, operator alertness becomes an increasing safety issue. A number of researchers have described the characteristics of alertness exhibited in the EEG signal [1] and have applied neural networks to estimating these alertness levels. Almost everyone knows that driving a motor vehicle under the influence of alcohol or other drugs is a deadly combination. However, few people seem to realize the danger associated with driving while fatigued. In fact, drivers who become drowsy or fall asleep at the wheel contribute to thousands of crashes each year.
Fatigue is a condition that affects everyone. Although typically associated with long-distance driving, fatigue can set in after a long day at work, an outing at the beach, or virtually any activity. Circadian rhythm, the body's natural rhythm associated with the earth's rotation, causes nearly everyone to be less alert or even drowsy between 1 and 5 p.m. We need to design a system which constantly monitors & analyzes the wakefulness of the driver and gives an alarm to the driver whenever he is about to go a state of drowsiness, thereby indicating that he is fatigued and needs to take a break and then resume the journey, thereby reducing the danger [Fig-1] not only to himself, but also to the other motorists on road.
Electroencephalogram are recordings of the small electrical potentials (generally less than 300μV) produced by the brain. The frequencies [Table-1] of these brain produced signals range from 0.5 to 100Hz, and their characteristics are highly dependent on the degree of activity of the cerebral cortex [2] .
A. Comparison with FFT
Common practice in EEG power spectral analysis is to calculate an individual Discrete Fourier Transform for a short section of EEG signal data [8] . This approach is based on calculating Fourier coefficients after all analog samples over the section of the signal are digitized by A/D converter.
B. Linear and nonlinear measures
Spectral theory is conventional and the most used
Linear tool in the analysis of bio signals. Spectral analysis [11] is used to investigate the signal‘s power in the various frequency bands and also the mutual relationships between more signals. It is based on Fourier transform which displays signal in the frequency domain [9] .
= 0 … N-1
Where x1 …. xi …. xN is signal measured in time domain, Xk is the amplitude corresponding to the kth frequency and N is the number of values. The power of particular frequency band is computed as the sum of modulus-square amplitudes belonging to this band. Here is an example of the power in alpha band (8Hz-12Hz):
Where 8 Hz is the lower limit of alpha band and 12Hz is the upper limit of alpha band. Another often computed index is coherence that reflects the degree of synchrony between signals from different derivations (brain areas). It is calculated as the ratio between cross spectrum of two signals and a product of their auto spectra:
Where PAB is the cross-spectral density, PA and PB is the auto spectral density of signals A and B respectively.
Hypnograms were developed to summarize the voluminous chart recordings of electrical activities (EEG, EOG, and EMG) collected during a night‘s sleep. Hypnograms provide a simple way to display information originally collected on many feet of chart paper or stored as large file on a computer.
The EEG frequencies in the frontal lobe of the brain are for the detection of the activity which detects the sleep stage of a person. Carefully analyzing the frequency we can determine the sleep stage. The signal is compared with a predetermined threshold value and if found to be below the required threshold, the device notifies the user by an alarm signal. The various samples are collected from different persons by placing the electrode on different positions of head. The EEG data in time domain is not sufficient to analyze, which has to be transformed to frequency domain to get the required frequency spectrum. The power analysis has to be done to determine the strength of the signal. This signal is subjected to hypnogram analysis to indicate the sleep stage which leads to an alarm. The algorithm was simulated using MATLAB 7.
As shown in the figure above EE G data is collected from the subject and the subsequent process can be divided into 3 stages.
i. In the first stage we convert the EEG data which is in time domain to frequency domain using power spectrum analysis.
ii In the next stage the result of power spectrum analysis is classified as wakefulness or sleep stage1.
iii. In the final stage we use hypnogram to plot the classified stages and give an alert whenever there is a transition from wakefulness to sleep stage1.
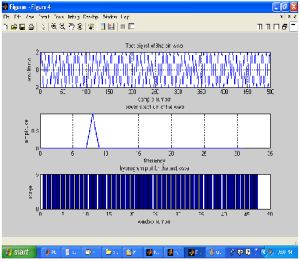
The figures show the results we have obtained for simulated signals used in our program. The first plot in each figure represents the test signals which have implemented in our program for testing it. The second plot represents the power spectrum for above mentioned test signals. The power spectrum shows the spike at particular frequency whereas in all other frequencies it will plot the value 0.
This is the output of the test signal passed to our program. We are sending 2hz sine wave and 8hz Cos wave, the spikes in the power spectrum on right side represents the 2Hz and 8Hz component of the wave. Hence the power spectrum perfectly determines the frequency components. The third plot is that of the hypnogram which plotted sleep stages versus time is. According to the program the sleep stage representing 2Hz and 8Hz is sleep stage 1 and it is perfectly showing it in the output screen of the hypnogram and hence the program is verified by passing test signals and hence it can be used for determining the sleep stages.
To conclude, the determination of sleep stages using the concept of hypnogram plot provides a solution to driver fatigue which is one of the major causes of road accidents. Technical devices to detect when drivers are feeling sleepy and provide warnings to them is the need of the hour & thus hardware implementation for real time as an extension must be done and this facility must be inbuilt & made mandatory for all vehicles. However, it may be that technological advancements in the long term would enable motor vehicles (with a few exemptions) to have some form of system that records and maintains a record of an individual‘s driving hours, no matter what vehicle they are driving. Secondly, as shown during the implementation of the program, this concept can have multiple applications such as recording & monitoring of sleep pattern of patients.
[1] Martin Glos, Christoph schobel, Michaela, Beate diecker and Ingo Fietze. (2009) Proceedings of 31st International Conference of the IEEE EMBS, 7099-7101.
» CrossRef » Google Scholar » PubMed » DOAJ » CAS » Scopus
[2] Md. Shahedul Amin, Md. Riayasat Azim, Tahmid Latif, Md. Ashraful Hoque and Foisal Mahedi Hasan. (2010) Proceedings of 2nd International Conference on Signal processing system. 106-110.
» CrossRef » Google Scholar » PubMed » DOAJ » CAS » Scopus
[3] Inoue K., Kumamaru K. and Matsuoka S. (1997) Japanese Journal of electroencephalography and Electromyography, 427-431.
» CrossRef » Google Scholar » PubMed » DOAJ » CAS » Scopus
[4] Inoue K., Tsujihata T., Kumamaru K. and Matsuoka S. (2005) Proceedings of the 16th IFAC World Congress.
» CrossRef » Google Scholar » PubMed » DOAJ » CAS » Scopus
[5] Besruk V.M., Kovalenko N.P. and Lysenko V.A. (2005) Bionics of Intelligence, 80-85.
» CrossRef » Google Scholar » PubMed » DOAJ » CAS » Scopus
[6] Walters A.S., Lavigne G., Hening W., Picchietti D.L., Allen R.P., Chokroverty S., Kushida C.A., Bliwise D.L., Mahowald M.W., Schenck C.H. and Ancoli-Israel S. (2007) Movements in sleep: A review by the movement task force of the American academy of sleep medicine, 155-167.
» CrossRef » Google Scholar » PubMed » DOAJ » CAS » Scopus
[7] Carskadon M.A. and Herz R. (2004) Minimal olfactory perception during sleep: why odor alarms will not work for humans Sleep, 402-405.
» CrossRef » Google Scholar » PubMed » DOAJ » CAS » Scopus
[8] Alan V. Oppenheim, and Ronald W. Schafer (1999) Digital Signal Processing, Twelfth printing, Prentice Hall of India.
» CrossRef » Google Scholar » PubMed » DOAJ » CAS » Scopus
[9] Willis J. Tompkins (2000) Biomedical Digital Signal Processing, Second printing, Prentice Hall of India.
» CrossRef » Google Scholar » PubMed » DOAJ » CAS » Scopus
[10] Reddy D.C. (2009) Biomedical Signal processing, Principles and Techniques, Seventh print, Tata McGraw-Hill Publishing Company Limited.
» CrossRef » Google Scholar » PubMed » DOAJ » CAS » Scopus
[11] Rangaraj M. Rangayyan. Biomedical Signal Analysis– A case Study Approach, IEEE press, wiley interscience, john wiley & sons, inc.
» CrossRef » Google Scholar » PubMed » DOAJ » CAS » Scopus
 | Fig. 1- Mangalore Tragedy |
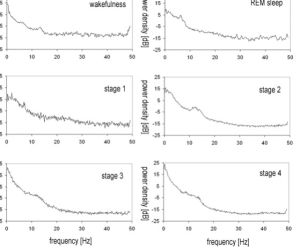 | Fig. 2- Power spectrum density in different sleep stages and in wakefulness, The EEG deviation in Fpz-Cz, all signals are from the first episode of NREM-REM sleep cycle. |
 | Fig. 3- Hypnogram showing sleep cycles from midnight to 6:30 AM with deep sleep early on. There in more REM before waking |
 | Fig. 4- Stages of EEG Analysis |
 | Fig. 5- simulated waveforms of 2Hz |
 | Fig. 6- simulated waveforms of 8Hz |
 | Fig. 7- Hypnogram representation |
 | Table. 1- Spectrum of EEG signals |