ISSN : 0976-5530
EISSN : 0976-5549

FARES K. KHALIFA1*
1Biochemistry and Nutrition Department Women’s College, Ain Shams University, Cairo, Egypt.
* Corresponding Author : dr_fares_asu@yahoo.com
Received : 04-12-2011 Accepted : 12-12-2011 Published : 27-12-2011
Volume : 2 Issue : 2 Pages : 84 - 92
Int J Med Clin Res 2.2 (2011):84-92
DOI : http://dx.doi.org/10.9735/0976-5530.2.2.84-92
Conflict of Interest : None declared
The purpose of this study was to evaluate the regulatory role of L-alanine supplementation at high level on hepatic gluconeogenesis in rats fed on either ketogenic diet and/or biotin deficient diet. Seven groups each of eight adult male Albino rats (Sprague-Dawely) strain, mean weight varied between 105.2. to 112.7 g were fed on basal control diet (CD), biotin deficient diet (BDD), ketogenic diet (KD), and ketogenic-biotin deficient diet (KBDD). L-alanine (L-Ala) was supplemented to biotin deficient and/or ketogenic diets at a level dose 10% throughout the experimental period (35 days). Plasma and liver were analyzed for biochemical parameters. The results showed that the plasma levels of glucose, insulin, free fatty acids (FFA), total proteins and liver glycogen were decreased significantly (p<0.01) in rats fed on biotin deficient (BDD) and ketogenic diets (KD and KBDD). Plasma β-hydroxybutyrate, acetoacetate, lactate, pyruvate, total cholesterol and triacylglycerol levels were significantly increased. Supplementation of L-alanine significantly restored these values near to normal value after 35 days of the experiment. Deficiency of biotin and feeding ketogenic diets reduced the activities of glucose-6-phosphatase (Glu-6-Pase), pyruvate carboxylase (PC), and phosphoenolpyruvate carboxykinase (PEP-CK) when compared to control. Addition of L-alanine increased the activity of Glu-6-Pase when compared to BDD and KD groups. The activities of PEP-CK and PC tended to be decreased in all tested rats when compared to control. The present study concluded that, supplementation of biotin-free diet and ketogenic diet with L-alanine stimulates glucose production and regulates hepatic gluconeogenesis.
Gluconeogenesis, L-Alanine, Biotin Deficiency, ketogenic diet, Ketotic Hypoglycemia.
crucial to the maintenance of a supply of glucose for the brain and for anaerobic energy production, as well as for providing glucose to the cells for biosynthesis [1] . This is particularly critical when food intake is restricted and liver glycogen stores are depleted. When the glycogen stores of the liver are exhausted after several hours of fasting, the supply of glucose is dependent on biosynthesis from nonglycosidic stores, primarily amino acids [2] . Gluconeogenesis from amino acids is a major and essential function of the liver in the maintenance of the supply of glucose at times when dietary glucose is lacking and glycogen reserves are low. The control of gluconeogenesis may occur in peripheral tissues to alter the supply of glucose precursors to the liver or may operate in the liver to control the uptake of the precursors and their conversion to glucose [3] . L-Alanine plays a central role as an intermediary between protein catabolism and carbohydrate generation. It is a key gluconeogenic substance and has also been associated with stimulating the release of glucagon and inhibiting ketosis [4] . In addition, it is insulinogenic, which moderates its tendency to raise plasma glucose. L-Alanine is released by muscle and taken up by the liver in greater amounts than any other amino acid and directly converted to glucose. The hepatic capacity for conversion of alanine to glucose exceeds that of all other amino acids [2] . Biotin is a water-soluble vitamin that acts as a prosthetic group in carboxylases, which catalyze steps along various biochemical pathways. These carboxylases play a critical role in the intermediate metabolism of gluconeogenesis, fatty acid synthesis, and amino acid catabolism [5] . Biotin also regulates the expression of insulin receptor [6] . Humans and other mammals cannot synthesize biotin and thus must obtain the vitamin from exogenous sources via intestinal absorption. After absorption, biotin is transported to different tissues and cell types for utilization. Biotin deficiency affects pancreatic islet functions and reduces the expression and activity of pancreatic glucokinase, a critical enzyme in glucose-induced insulin secretion [7] . Less attention has been paid to the antiketotic action of alanine, which has been observed after administration to obese subjects undergoing prolonged starvation and to children with ketotic hypoglycemia, which is the most common form of hypoglycemia. The hallmark of the ketotic hypoglycemia disorder is the appearance of recurrent episodes of hypoglycemia and ketosis. The ketogenic diet (KD) is designed to simulate the biochemical effects of fasting by maintaining a state of ketosis [8] . Ketogenic diet is high in fat and low in protein and carbohydrates, and induces a metabolic state in which the brain metabolizes ketone bodies (acetoacetate and β-hydroxybutyrate) produced by the liver [9] . It was, therefore, thought of interest to determine the effects of L-alanine supplementation on ketosis occurring in ketogenic diet-fed rats in which gluconeogenesis is accelerated, and in biotin deficient diet-fed rats of which insulin release is absent. The present study was conducted to evaluate the biochemical role of L-alanine supplementation at high level in the regulation of gluconeogenesis in rats fed either ketogenic diet and/or biotin deficient diet.
L-Alanine (L-Ala) was purchased from EL-Nasr Pharmaceutical Chemicals Co., Cairo, Egypt. L-Ala was added to the biotin deficient and ketogenic diets at a level of 10 g/100 g diet.
Seven homogenous groups each of eight adult male Albino rats (Sprague-Dawely) strain, mean weight varied between 105.2. to 112.7 g were used. The animals were 5 weeks old at the beginning of the experiment. They were obtained from Helwan breeding farm, Cairo, Egypt. Animals received human care, housed individually in stainless steel cages with wire mesh bottoms and maintained at temperature 25°C ±1°C, humidity 50% ± 10% and light dark cycle held constant 12/12 h. During the experiment, food and water were provided ad libitum.
[Table-1] shows the composition of the different experimental diets.
At the end of the experiment (5 weeks), rats were fasted for 12 hrs, then the animals were anesthetized by ether and blood samples were taken from hepatic portal vein by syringe and transferred into heparinized centrifuge tubes. The tubes centrifuged at 10000 x g for 20 minutes at 15°C to provide plasma needed for the biochemical analysis. Plasma samples were taken and kept in dry clean plastic and stored at □20□C till used for the different analysis Fresh plasma was tested for content of fasting glucose by enzymatic colorimetric procedure kit [10] , β-hydroxybutyrate and acetoacetate levels were determined by calorimetric method kits [11] , pyruvate level was measured by colorimetric assay kit [12] , and lactate level was determined by colorimetric method kit [13] . Within 4 days plasma was tested for content of total cholesterol by enzymatic colorimetric method kit [14] , triacylglycerols by enzymatic colorimetric method kit [15] , insulin was determined by radioimmunoassay method [16] , free fatty acids were measured by enzymatic method kit [17] , and total protein level was measured by colorimetric method kit [18] .
Liver was separated, rinsed and washed with saline solution (NaCl 0.9%), then blotted on filter paper. The liver was rapidly freeze-clamped and stored at -20ºC for glycogen and enzymes analysis. For the determination of glycogen, 0.5-1.0 g of liver was rapidly excised and digested in 30%, (w/v) KOH, and glycogen was isolated according to Emile [19] . It was hydrolyzed with 0.6N H2SO4 and neutralized, and an aliquot was used for measurement. A known amount of liver was weighed and homogenized in a 0.25M sucrose medium containing 0.02M Tris-HCl buffer, pH 7.4 to get a homogenate. The homogenate was centrifuged at 10000 x g for 30 min at 4ºC in a type Beckman rotor, and the supernatant extract was stored at □20□C till used for the enzymes assays. Livers for enzymes assays were analyzed within 4 days. Enzymes activities were measured according the following methods; pyruvate carboxylase [20] , phosphoenolpyruvate carboxykinase [21] , and Glucose-6-phosphatase [22] .
Statistical Analysis
The data were statistically analyzed by SPSS version 10.0 statistical packages. Data were presented as the means ± SD; statistical differences between groups were performed using t-test. Differences were considered significant when p<0.01.
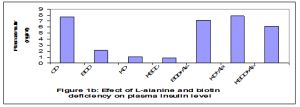
Plasma fasting glucose and insulin levels were decreased significantly (p<0.01) in rats fed on biotin deficient and ketogenic diets (G2-G4) throughout the experimental periods (35 days) when compared to the control group. An observed increase in plasma fasting glucose and insulin levels were recorded in all the tested rats which fed on diets supplemented with L-alanine. Plasma glucose analysis revealed that fasting glucose concentration in rats fed on biotin deficient diet (G2) and ketogenic diet (G3) lowered than control value by 33.3% and 41.8 respectively [Fig-1a] , [Fig-1b] .
Liver glycogen level was decreased significantly (p<0.01) in rats fed on ketogenic diet alone (G3) or in addition to biotin deficiency (G4) when compared to control and improved by L-alanine supplementation (G5-G7). Addition of L-alanine at a level 10% significantly prevented these changes and restored these values near to normal value after 35 days of the experiment [Fig-2] .
Ketogenic diet (KD) and biotin deficient diet (BDD) feeding alone or in combination (KBDD) resulted in a significant increase (p<0.01) in plasma β-hydroxybutyrate and acetoacetate concentration as compared to control. L-alanine supplementation significantly (p<0.01) decreased plasma ketone bodies concentrations in all supplemented groups as compared to non-supplemented groups [Fig-3a] .
The ratio of βOHB/AcAc was significantly (p<0.01) higher in plasma of ketotic rats fed on ketogenic diets compared to control rats and gradually reduced by L-alanine [Fig-3b] .
Feeding biotin deficient diet (G2) or ketogenic diet (G3) or in combination (G4) reduced the plasma level of free fatty acids (FFA) when compared to control. Whereas, supplementation of L-alanine at a high dose (10%) normalized FFA concentrations throughout the experimental period (35days) [Fig-3c] .
Biotin deficient diet caused significant increase in plasma lactate level and lactate/pyruvate ratio in G2 (BDD) and G4 (KBDD) as compared with control [Fig-4a] , [Fig-4c] . L-alanine supplementation improved significantly (p<0.01) plasma lactate levels and lactate/pyruvate ratio. Plasma pyruvate level was significantly increased in rats fed on ketogenic biotin deficient diet supplemented with L-alanine [Fig-4b] .
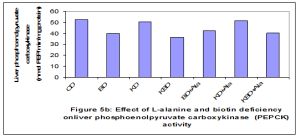
Deficiency of biotin and feeding ketogenic diets reduced the activities of glu-6-phosphatase (Glu-6-Pase), and pyruvate carboxylase (PC) when compared to control. Addition of L-alanine at a high dose (10%) increased the activity of G-6-Pase when compared to BDD and KD groups [Fig-5c] . While the activity of PC tended to be decreased in all tested rats (G2-G7) throughout the experimental periods (35 days) as compared to G1 [Fig-5a] . The activity of PEPCK enzyme was reduced significantly (p<0.01) in all rat groups fed biotin deficient diets when compared to G1 [Fig-5b] . On the other hand the activity of PEPCK was not affected by feeding ketogenic diet alone (KD) or supplemented with L-alanine (KD+L-Ala) when compared with control.
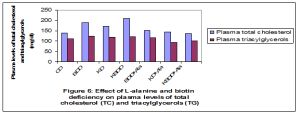
Plasma concentrations of total cholesterol and triacylglycerols were elevated significantly (p<0.01) in rats fed on biotin deficient and ketogenic diets (G2-G4) compared with G1 and normalized by L-alanine supplementation [Fig-6] . The levels of plasma total proteins were significantly lowered (p<0.01) in ketogenic and biotin deficient rats as compared to control, and gradually increased by adding L-alanine (GG7) [Fig-7] .
Blood glucose is maintained during the post absorptive state by hepatic glycogenolysis and by gluconeogenesis, if fasting is prolonged. There is a dynamic equilibrium that maintains a constant and controlled supply of glucose to the tissues, whilst maintaining blood glucose in a narrow range, in both the fed and fasting state. This balance is primarily dependent on the hormonal control of glucose uptake by insulin into the muscles in the fed state, and by glucagon and counter-regulatory hormones leading to glucose release from the liver in the fasted state [2] . The results of the present study showed significant increase in the plasma glucose levels after alanine supplementation. This increase can be interpreted as an expression of gluconeogenesis [23] . Since alanine is known to promote both gluconeogenesis and glycogenolysis through stimulation of glucagon production [24] . Thus, an alanine-induced rise of blood glucose cannot be attributed to gluconeogenesis alone unless the glycogen stores of the liver have been depleted by feeding ketogenic diet, as indicated by a low fasting glucose concentration [Fig-1a] . To ensure that the rats were in a ketotic state, the amount of β-hydroxybutyrate in blood was measured and was found to be significantly higher in rats fed on ketogenic diet (KD) compared with the controls. In addition, glucose levels have been reported to be decreased in plasma of adult rats subjected to the KD. Ketotic hypoglycemia is the most common form of hypoglycemia which can be uniformly provoked by a brief fast after feeding a hypocaloric high fat, low carbohydrate diet [25] . The results of the present study demonstrated that biotin deficiency promotes hyperglycemic mechanisms such as decreased insulin secretion [Fig-1b] and sensitivity to compensate for reduced blood glucose concentrations [26] . The physiological concentrations of biotin are required for the normal expression of critical carbohydrate metabolism genes and for glucose homeostasis [27] . Glucose homeostasis is an exquisite mechanism that involves glucose disposal and glucose production. In the fasting state, hepatic gluconeogenesis is critical to maintain normoglycemia. This metabolic pathway requires the catalytic action of the biotin-dependent enzyme pyruvate carboxylase [28] . The data on the fasting plasma glucose levels showed marked hypoglycemia in biotin-deficient rats which is consistent with the role of biotin in gluconeogenesis and reflects the decreased gluconeogenic capability in rats under a biotin-free diet. The stability of plasma glucose after L-alanine supplementation in the present study showed the importance of alanine as a mediator of its hyperglycemic effect. Previous studies have underscored the importance of glucagon stimulation by intravenous alanine as a mediator of its hyperglycemic effect†[23] . The present results emphasize that stimulation of insulin release by L-alanine must also be considered an important modulator of its conversion to glucose. The inability of ketotic hypoglycemic rats to maintain normal blood glucose levels when fasted or maintained on a ketogenic diet for periods of 24 hr or longer is highly suggestive of a functional defect in hepatic gluconeogenesis [29] . As the results of the present study showed that the liver glycogen stores were depleted during a hypoglycemia provoked by a ketogenic diet, thus the glucose increase induced by L-alanine supplementation points to gluconeogenesis rather than to glycogenolysis [23] . In tissues with the capacity for gluconeogenesis as well as glycolysis within the same cell, as occurs in liver, opposing regulation of the two metabolic processes is necessary to facilitate glucose formation in the required direction and avoid energy wasting futile recycling at various stages [30] . Alanine is formed extrahepatically by transamination of glucose-derived pyruvate and transported to the liver through glucose-alanine cycle, where its carbon skeleton is reconverted into glucose [31] . This glucose-alanine cycle is disrupted in case of either a deficient production of alanine in the muscles or a deficient conversion of alanine into glucose in the liver [31] . Thus it appears that alanine might act as an inducer of gluconeogenesis, initiating the switchover from more glycolytic to more gluconeogenic conditions. Gluconeogenesis is controlled by the rate of oxidation of fatty acids. Either increased FFA oxidation or hyperglycemia may be responsible for hepatic insulin resistance. During biotin deficiency in rats, adipose tissue stores are depleted of lipid and there occurs a gradual but marked decrease in the levels of free fatty acids circulating in plasma [32] . The results of the present study showed that the rise in free fatty acids produced by alanine supplementation in biotin deficient and ketogenic rats [Fig-3c] may be produced by glucagon effect, which has been shown to be lipolytic in animal studies [33] . A similar combination of decreased plasma ketoacids and increased plasma free fatty acids has been produced by blockade of free fatty acid transfer in the liver from the cytoplasm to the mitochondria. The present study suggested the possibility that ketogenesis in conjunction with gluconeogenesis may be regulated by alanine supply. In addition, oxidative deamination of alanine to pyruvate, with subsequent conversion to lactate, could thus be responsible for alanine’s antiketotic action [34] . The results of the present study demonstrate significant increase in βOHB/AcAc ratio in biotin deficient and ketogenic diets-fed rats and decreased by L-alanine supplementation [Fig-3b] . The levels of lactate in the biotin-deficient rats were approximately twice as high as in the control. Plasma lactate and pyruvate levels were measured as an index of the availability of gluconeogenic precursors in normal and ketotic hypoglycemic rats. The ratios of lactate/pyruvate and β-hydroxy butyrate/acetoacetate (β-OHB/AcAc) are good indices of the redox state of the NAD+ system in liver cytosol and mitochondria, respectively, and therefore measure the availability of reducing equivalents in these cell compartments [35] . Rats fed ketogenic diets must maintain reasonable rates of gluconeogenesis to maintain blood glucose levels. However, with time, lipid metabolism aids the glucose economy of the animal by decreasing peripheral utilization, by increasing rates of gluconeogenesis in the liver and by producing ketone bodies. Ketone bodies can be used by the brain to substitute, at least in part, for the glucose that would normally be utilized for energy. This change in substrate availability may account for the lower total gluconeogenesis in the rats fed ketogenic diet compared with those fed high alanine diets. L-Alanine stimulates glucose formation in biotin deficient and ketogenic diets- fed rat. Concomitantly with the stimulation of glucose formation in the presence of L-alanine an inhibition of lactate formation was observed. There is good correlation between the magnitude of the stimulatory effect on glucose formation and the inhibitory effect on lactate formation in the presence of L-alanine has been shown by the results of the present study [Fig-1a] , [Fig-4a] . The key enzyme for gluconeogenesis is phosphoenolpyruvate carboxykinase (PEP-CK), which converts oxaloacetate to phosphoenolpyruvate, the final product of the glycolytic pathway before pyruvate. In a study on the effect of biotin deficiency on pyruvate metabolism it was reported that pyruvate conversion into glucose by rat liver slices was affected as a result of a decrease in pyruvate carboxylase activity [36] . The reported reduction in activity of PEP carboxykinase in homogenates of biotin-deficient rats' livers could be due to decreased synthesis of oxalacetate from pyruvate via pyruvate carboxylase than from PEP by PEP carboxykinase [37] . Pyruvate carboxylase, a key enzyme in the gluconeogenic pathway, and thus biotin plays a direct role in gluconeogenesis. In biotin deficient animals, gluconeogenesis was impaired by the partial metabolic block at the pyruvate carboxylase step, which was expected, since pyruvate carboxylase is a biotin-dependent enzyme [38] . The results confirmed that the primary blocks is at the pyruvate carboxylation step is seen from the marked increase in the levels of pyruvate and lactate. Ferreira and Weiss [39] have been also noted an increase in blood pyruvate in biotin deficiency. The activities of the two key enzymes of gluconeogenesis, pyruvate carboxylase and phosphoenolpyruvate carboxykinase was affected by alanine supplementation. L-Alanine at high concentrations (10%) has been shown to stimulate hepatic gluconeogenesis in a catalytic way [40] . Glucose-6-phosphatase (Glu-6-Pase) is an enzyme that hydrolyzes glucose-6-phosphate resulting in the creation of a phosphate group and free glucose. Glucose is then exported from the cell via glucose transporter membrane proteins. This catalysis completes the final step in gluconeogenesis and glycogenolysis and therefore plays a key role in the homeostatic regulation of blood glucose levels [41] . The results of the present study showed that the activity of Glu-6-Pase was reduced significantly in rats fed on either biotin deficient (BDD) or ketogenic diets (KD and KBDD) and gradually increased by L-alanine supplementation [Fig-5c] . This increase in Glu-6-Pase activity may be due to the differences in insulin sensitivity [42] . Enhanced FFA oxidation has been also shown to increase Glu-6-Pase activity in rat liver. In the present study, plasma ketone bodies, indirect measures of hepatic FFA oxidation, were significantly increased in ketogenic and biotin deficient diet-fed rats, suggesting that increased hepatic FFA oxidation may have altered hepatic insulin sensitivity by increasing Glu-6-Pase activity [41] . The results of the present study showed that the levels of plasma total proteins were lowered in ketogenic and biotin deficient rats as compared to control, and gradually increased by adding L-alanine [Fig-7] . It has been reported that there is a relationship between biotin and protein metabolism, biotin deficiency decreases the incorporation of amino acids into liver protein in rats which implicates this vitamin in the biosynthesis of protein [5] . These effects were demonstrated to be related to interference with some of the various reactions involved in the Krebs cycle in which biotin is known to take part, with consequent decrease in the release of adequate energy for the synthesis of protein and nucleic acid. In the present study, therefore, the decrease in total plasma protein may be due to diminished synthesis of these components by the liver of biotin-deficient rats. The changes in plasma proteins in biotin deficiency indicate the interrelationship of biotin nutrition and protein metabolism in the body. It has been known for some time that during the early stages of starvation, after depletion of glycogen stores, proteolysis is increased, and the glucogenic amino acids, among these predominantly alanine, serve as substrates for hepatic gluconeogenesis [43] . Alanine, which has been shown to be an important carrier of nitrogen and carbon from the muscle during protein degradation, might be expected to have a greater role when protein catabolism is in excess than when protein is adequate or limiting. In the case of rats fed on either ketogenic diet (KD), or ketogenic-biotin deficient diet (KBDD) there is a marked increase in protein catabolism and increased gluconeogenesis. It has been hypothesized that ketogenic low carbohydrate diets may have a ‘‘metabolic advantage’’ by necessitating increased gluconeogenesis (less energy efficient than glycolytic pathways) [44] . During feeding low carbohydrate ketogenic diet there is a reduction in glucose supply, which initiates compensatory gluconeogenic mechanisms to sustain glucose-dependent tissue [45] . Spontaneous symptoms of biotin deficiency were detected in rats genetically prone to development of elevated blood lipids [39] . In the present study, an inverse association was found between plasma lipids and biotin status. The results showed that biotin deficiency for 35 days increased plasma total cholesterol in all rats when compared with control group [Fig-6] . These observations support the concept that biotin deficiency increased plasma lipids [7] . The effects of biotin on carbohydrate metabolism and the lack of toxic effects of the vitamin at pharmacological doses suggest that biotin could be used in the development of new therapeutics in the treatment of hyperglycemia and hyperlipidemia. The present study concluded that, the supplementation with L-alanine at high level reversed the metabolic consequences of diminished gluconeogenesis; it also stimulates glucose formation in rats fed on either ketogenic diet and/or biotin deficient diet.
[1] Pellerin L. (2010) J. Diabetes Metab., 36 (3), S59-S63.
» CrossRef » Google Scholar » PubMed » DOAJ » CAS » Scopus
[2] Iain C. (2011) Anaesth. Intensive Care Med., 12 (4), 176-178.
» CrossRef » Google Scholar » PubMed » DOAJ » CAS » Scopus
[3] Xiao-mei L., Jing K., Wei-wei S. and Yan L. (2009) Chin. Med. Sci., 24 (4), 208-212.
» CrossRef » Google Scholar » PubMed » DOAJ » CAS » Scopus
[4] Chacko S., Ordonez J., Sauer P. and Sunehag A. (2011) Pediatrics, 158 (6): 891-896.
» CrossRef » Google Scholar » PubMed » DOAJ » CAS » Scopus
[5] Antonio V., MarÃa D.H., Rafael M.S., Daniel O., Nayeli R. and Saúl C. (2008) 95 (4), 213-219.
» CrossRef » Google Scholar » PubMed » DOAJ » CAS » Scopus
[6] Alonso V., Armando R.T., Alvaro M., Alberto R. and Cristina F. (2010) Nutr. Biochem., 21 (7), 606-612.
» CrossRef » Google Scholar » PubMed » DOAJ » CAS » Scopus
[7] Elena L., Fidel V., Paz V., Teresita L. and MarÃa L. (2010) Eur. J. Pharmc., 644 (1), 263-268.
» CrossRef » Google Scholar » PubMed » DOAJ » CAS » Scopus
[8] Kirk N., Sergei L. and McIntyre W.B. (2009) Neurotherapeutics, 6 (2), 402-405.
» CrossRef » Google Scholar » PubMed » DOAJ » CAS » Scopus
[9] Eric H.K. and Jong M.R. (2009) Neurotherapeutics, 6 (2): 406-414.
» CrossRef » Google Scholar » PubMed » DOAJ » CAS » Scopus
[10] Trinder, P. (1969) Ann. Clin. Biochem., 6, 24-27.
» CrossRef » Google Scholar » PubMed » DOAJ » CAS » Scopus
[11] Harano Y., Kosugi K. and Hyosu T. (1983) Clin. Chim. Acta, 134, 327-336.
» CrossRef » Google Scholar » PubMed » DOAJ » CAS » Scopus
[12] Bücher T., Czok R., Lamprecht W. and Latzko E. (1965) In Bergmeyer H.U. New York, Academic Press, pp 253-259.
» CrossRef » Google Scholar » PubMed » DOAJ » CAS » Scopus
[13] Hohorst H.J. (1965) In Bergmeyer H.U. New York, Academic Press, 1965, pp 266-270.
» CrossRef » Google Scholar » PubMed » DOAJ » CAS » Scopus
[14] Allain C.C., Poon L.S., Chon C.S., Richmond U. and Fu P.C. (1974) Clin. Chem., 20, 470–475.
» CrossRef » Google Scholar » PubMed » DOAJ » CAS » Scopus
[15] Werner M., Gabrielson D.G. and Eastman G. (1981) Clin. Chem., 21, 268–271.
» CrossRef » Google Scholar » PubMed » DOAJ » CAS » Scopus
[16] Morgan C.R. and Lazarow A. (1963) Diabetes, 12, 115-126.
» CrossRef » Google Scholar » PubMed » DOAJ » CAS » Scopus
[17] Okabe H., Uji Y., Nagashima K. and Noma A. (1980) Clin. Chem., 26, 1540-1543.
» CrossRef » Google Scholar » PubMed » DOAJ » CAS » Scopus
[18] Lowry O.H., Rosebrough N.J., Farr A.L. and Randall R.J. (1951) J. Biol. Chem., 193, 265-275.
» CrossRef » Google Scholar » PubMed » DOAJ » CAS » Scopus
[19] Emile V.H. (1965) Aanal. Biochem. 11, 256-265.
» CrossRef » Google Scholar » PubMed » DOAJ » CAS » Scopus
[20] Freedman A.D. and Kohn L.L. (1964) Science, 145, 58–60.
» CrossRef » Google Scholar » PubMed » DOAJ » CAS » Scopus
[21] Walsh A., and Chen L.J. (1971) Biochem. biophys. Res. Commun., 45, 669-675.
» CrossRef » Google Scholar » PubMed » DOAJ » CAS » Scopus
[22] Harper A.E. (1964) In Bergmeyer H.U., Academic Press, N. Y., p. 788.
» CrossRef » Google Scholar » PubMed » DOAJ » CAS » Scopus
[23] Porcellati F., Pampanelli S., Rossetti P. and Busciantella N.R. (2007) Diabetologia, 50 (2), 422-430.
» CrossRef » Google Scholar » PubMed » DOAJ » CAS » Scopus
[24] Kátia F.N., Rosângela F.G., Vilma A.F., Helenir M.S., Simoni O. and Roberto B.B. (2008) Life Sciences, 82 (19), 1018-1022.
» CrossRef » Google Scholar » PubMed » DOAJ » CAS » Scopus
[25] Jami J. And Donald Z. (2009) Clin. Pediatric Emerg. Med., 10 (4), 285-291.
» CrossRef » Google Scholar » PubMed » DOAJ » CAS » Scopus
[26] Fernandez-Mejia C. (2005) J. Nutr. Biochem., 16, 424–427.
» CrossRef » Google Scholar » PubMed » DOAJ » CAS » Scopus
[27] Ferreira G., and Weiss W.P. (2007) J. Dairy Sci., 90 (3), 1460-1466.
» CrossRef » Google Scholar » PubMed » DOAJ » CAS » Scopus
[28] Isaac M.V., Charles R.R., and Juan M.P. (2010) Mol. Genetics Metab., 101, 9-17.
» CrossRef » Google Scholar » PubMed » DOAJ » CAS » Scopus
[29] Maarten R.S., Hidde H.H., Marinus D., Mariëtte T.A. and Erik E. (2010) Metabolism, 59 (11), 1543-1550.
» CrossRef » Google Scholar » PubMed » DOAJ » CAS » Scopus
[30] Maughan R. (2009) Surgery (Oxford), 27 (1), 6-10.
» CrossRef » Google Scholar » PubMed » DOAJ » CAS » Scopus
[31] John T.B. (2003) J. Nutr., 133: 2068S-2072S.
» CrossRef » Google Scholar » PubMed » DOAJ » CAS » Scopus
[32] Kalervo J.H., Zhijun C., Antti M.H., Rik K.W. and Alexander J.K. (2010) Lipid Res., 49 (1), 27-45.
» CrossRef » Google Scholar » PubMed » DOAJ » CAS » Scopus
[33] Kristy M.H., Kirk M.H., Jonathan D., Paul T.P., Diego P. and Brian W. (2010) Physiol. Behav., 100 (5), 545-548.
» CrossRef » Google Scholar » PubMed » DOAJ » CAS » Scopus
[34] Marc Y., Yevgeny D., Ilana N., Adam L. and Itzhak N. (2001) J Neuroscience Res., 66 (2), 272–281.
» CrossRef » Google Scholar » PubMed » DOAJ » CAS » Scopus
[35] Guillaume V., Hervé D., Karine C., Cécile C. and Nellie T. (2011) J. Hepatol., 54 (2), 348-356.
» CrossRef » Google Scholar » PubMed » DOAJ » CAS » Scopus
[36] Rocı´o R.M., Martha E.P., Alejandra D., Alejandra D. and Ignacio C. (1999) Mol. Genetics Metab., 66,16–23.
» CrossRef » Google Scholar » PubMed » DOAJ » CAS » Scopus
[37] Krishnamurti D. and Jashir C. (1988) Ann. Rev. Nutr., 8, 211-33.
» CrossRef » Google Scholar » PubMed » DOAJ » CAS » Scopus
[38] Nayeli R., Itzel L., Gabriela R. and Antonio V. (2007) Mol. Genetics Metab., 92 (3), 222-228.
» CrossRef » Google Scholar » PubMed » DOAJ » CAS » Scopus
[39] Dakshinamurti K. (2005) Nutr. Biochem. 16 (7), 419-423.
» CrossRef » Google Scholar » PubMed » DOAJ » CAS » Scopus
[40] Zorzano A. and Herrera E. (1984) Inter. J. Biochem., 16 (3), 263-267.
» CrossRef » Google Scholar » PubMed » DOAJ » CAS » Scopus
[41] Mithieux G. (2009) Nutr. 25 (9), 881-884.
» CrossRef » Google Scholar » PubMed » DOAJ » CAS » Scopus
[42] Mithieux G. (2010) Diabetes Metab. 36 (3), S50-S53.
» CrossRef » Google Scholar » PubMed » DOAJ » CAS » Scopus
[43] Yang H., Ierapetritou M.G., and Roth C.M. (2010) Biophys. Chem., 152 (1), 89-98.
» CrossRef » Google Scholar » PubMed » DOAJ » CAS » Scopus
[44] Segal-Isaacson C.J., Johnson S., Tomuta V., Cowell B., and Stein D.T. (2004) Obesity Res., 12, 130S–140S.
» CrossRef » Google Scholar » PubMed » DOAJ » CAS » Scopus
[45] Hoffer W., Bistrian B.R. and Young V.R. (1984) J. Clin. Invest. 73, 750–758.
» CrossRef » Google Scholar » PubMed » DOAJ » CAS » Scopus
 | Fig. 1a- |
 | Fig. 1b- |
 | Fig. 2- |
 | Fig. 3a- |
 | Fig. 3b- |
 | Fig. 3c- |
 | Fig. 4a- |
 | Fig. 4b- |
 | Fig. 4c- |
 | Fig. 5a- |
 | Fig. 5b- |
 | Fig. 5c- |
 | Fig. 6- |
 | Fig. 7- |
 | Table 1- The composition of the experimental diets (g /100 g diet) CD = Control diet; BDD= Biotin deficient diet; KD= Ketogenic diet; KBDD= Ketogenic biotin deficient diet; Ala= L-Alanine *Vitamin mixture is completely free of biotin ** Vitamin mixture contains 20 mg biotin/kg vitamin mix. |