ISSN : 0976-5530
EISSN : 0976-5549

KHOT S.T.1*, PRASAD R.K.2
1Bharati Vidyapeeth (Deemed Univ.) Pune- 411 030, MS, India.
2Bharati Vidyapeeth (Deemed Univ.) Pune- 411 030, MS, India.
* Corresponding Author : khotst@gmail.com
Received : 15-05-2012 Accepted : 03-07-2012 Published : 01-08-2012
Volume : 3 Issue : 6 Pages : 190 - 194
Int J Med Clin Res 3.6 (2012):190-194
DOI : http://dx.doi.org/10.9735/0976-5530.3.6.190-194
Conflict of Interest : None declared
Blood Cell segmentation is a challenging problem due to both the complex nature of the cells and the uncertainty present in video microscopy. Manual methods for this purpose are imprecise and highly subjective, thus requiring automated methods that perform this task in an objective and efficient way. In this project, we propose a novel method to segment blood cells by performing standard count and classifying white blood cells by differential count. Two types of blood cell analysis are performed: complete blood count and differential blood count. In complete blood count the numbers of erythrocytes (red cells), leukocytes (white cells) and platelets in the blood (the blood in the circulatory system) are counted to obtain a concentration of cells per unit volume. In a differential blood count the different classes of leukocytes (WBC) in the blood are counted to provide a more detailed diagnosis. Thus, the idea of our project is to serve the pathologists, medical technicians for the same, by using Image Processing techniques. This project is an attempt to embed visual perception and statistical intelligence of pathologist in “Image Processing Systemâ€. It uses dedicated algorithms to process the image of the blood sample.
Blood Cell segmentation, standard count, differential blood count.
The blood consists of a suspension of special cells in liquid called plasma. In the blood special cells are present, classified as Erythrocytes and Leukocytes. There are also platelets which are not considered real cells. In the following, we will deal the different categories of blood cells.
The erythrocytes are the most numerous blood cells i.e. about 4-6 millions/mm3. They are also called red cells. These are responsible for providing oxygen to tissues and partly for recovering carbon dioxide produced as waste.
The main function of platelets, or thrombocytes, is to stop the loss of blood from wounds. In the smear stained by Geimsa, they have an intense purple colour. Their diameter is 2-3 µm. their density in the blood is 200000-300000/mm3.
Leukocytes, or white cells, are responsible for the defence of the organism. The density of the leukocytes in the blood is 5000-7000/mm3. Leukocytes divide in two categories: granulocytes and lymphoid cells or agranulocytes. The term granulocyte is due to the presence of granules in the cytoplasm of these cells. So, granulocytes distinguish themselves in Neutrophil, Eosinophil and Basophiles. The lymphoid cells, instead, distinguish themselves in Lymphocyte and Monocyte .Each type of leukocyte is present in the blood in different proportions:
• Neutrophil: - 50 to 70 %
• Eosinophil: - 2 to 4 %
• Basophil: - 0.5 to 1 %
• Lymphocyte: - 20 to 40 %
• Monocyte: - 3 to 8 %
The neutrophil are the more common leukocytes. They have a diameter of 12-15 µm. The cytoplasm is transparent because its granules are small and faintly pink colored.
Eosinophil has the same size as the neutrophil. Generally their nucleus is bi-lobed. The cytoplasm is full of granules which assume a characteristic pink-orange color.
Basophiles are the rarest leukocytes: less than 1 %. They are quite small: 9-10 µm in diameter. Cytoplasm is very rich in granules which take a dark purple color. The nucleus is bi- or tri-lobed, but it is hard to see because of the number of granules which hide it.
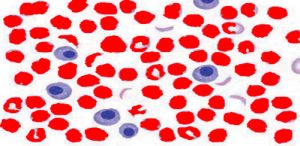
Lymphocytes are quite common in the blood: 20-40%, 8-10 µm in diameter and generally they are smaller than the other leukocytes but they are still a few larger than red cells [Fig-11] . The cytoplasm is transparent. The nucleus is round and large in comparison to the cell and it occupies most of it.
Monocytes are the biggest leukocytes: 16-20 µm. They have a horseshoe-shaped nucleus, in some cases even bi-lobed. The cytoplasm is transparent, but with an appearance of "ground glass".
In day to day life, blood cell analysis i.e. complete blood check (CBC) is the most recommended test by doctors in which it gives the count of Red Blood Cell (RBC) and white blood cell (WBC). These reports can be broadly classified as
1. Standard count for RBC and WBC
2. Differential count for WBC into its constituents “Cytes†and “Philsâ€.
In manual counting first a blood smear is prepared with a specific stain and kept under microscope for observation. A suitable magnification of microscope is selected to get a clear image of blood cells. The focus is adjusted to a small part of the blood slide and the pathologists’ observe through the microscope and simultaneously taps a button on blood cell counter as they count the particular blood cell. Blood cell counter is a device which has tap buttons with corresponding labels and with every tap the count gets incremented. Again the same procedure is repeated for different area by shifting the region of interest. In this way we get the total count of the blood cells.
This method is mainly used to detect diseases and abnormalities in blood cells for e.g. malarial parasites, RBC disorders but on the other side this is very tedious and time consuming. It also requires lot of hard work of the pathologists’ and also may result in human errors.
Automatic counting is done with the help of a machine named as Automatic Hematology Analyzer. It consists of a LCD screen, blood sucker rod, some diluting solutions inside the chambers, and an outlet for disposal. Firstly the blood solution is sucked by rod inside the chamber then the blood is diluted by different diluting solutions and then it is processed. After processing, the count is displayed on the LCD screen and a slip of result along with the RGB histogram plot comes out from the machine.
This machine overcomes the disadvantages of manual counting but its installation and maintenance cost is more.
Software approach is a computerized system for blood cell analysis. It gives a fast and affordable way for producing the reports. Also the same digital image can be used again and again for reprocessing and it can be analyzed at each and every output stage. The main purpose of this method is to serve the pathologist.
In this software the analysis is categorized into 2 parts that is standard count and differential count. In standard count, RBC, WBC and Platelets are counted and in differential count WBC is further classified into its constituent “Cytes†and “Philesâ€.
We are using digital image processing to generate the reports. Here we are segmenting, classifying and counting the blood cells using different image processing algorithms.
The color images of the blood smear on the slide are captured using a digital camera mounted on the microscope .The images used in this work are in BMP format. This acquisition takes place by placing a digital camera above microscopic lens. Blood slide is kept under oil immersion. Image taken by microscope is with 400X or 1000X magnification. Images are then transferred to computer system for further processing. The system can be used as real time system, by recording the images directly from a camera mounted on microscope and connecting to the computer system through USB card. Each image consists of red blood cells; one or more white blood cells and platelets.
The result from image acquisition sometime causes the noise and some dirt in the images; therefore a pre-processing can be done using various filters such as median filter. [6.2.1]
Standard count is a method to recognize and count the blood cells in a blood sample. In standard count first the initial RGB (Red Green Blue) image is converted into HSV (Hue Saturation Value) as HSV model is more efficient. [6.2.1]
And then image is sharpen to get more clear view of the edges. The image is then thresholded using the average pixel value of the blood cell as the threshold value.
Then the median filter is applied to remove noise like salt and pepper noise. In this approach we have used a series of median filter to get a image with minimum data loss and more noise removal.
Dilation and hole filling is apply to remove intrusions and to reconnect the segmented nucleus in the process of thresholding. [6.2.3]
In labelling the blobs are detected and labelled according to the number of pixels in the image.
Then according to the labelling, blood cells are identified and counted.
Differential count is performed for WBC only. It provides the counts for lymphocytes, Monocyte, Neutrophil, Eosinophil, and basophiles.
For further classification of WBC, it has to be segmented first. For this WBC has to be isolated from its background by eliminating background.
By background elimination, RBC and platelets are removed, and we are remained only with WBC. To remove background, we can use RGB histogram but it depends on illumination of the image. That is, if illumination changes shape of the histogram also changes. So for background elimination, RGB image is first converted into an HSV image to remove the illumination of the image.
If we have to segment image, based on color, we have to think of HSV because colors are conveniently represented in hue image. In HSV image, hue represents color attribute that describes pure color. Saturation gives the measure of degree to which pure color is diluted by white light, and intensity describes color sensation.
Then we extract s-plane, that is the saturation plane. Saturation is used as a masking image in order to isolate further region of interest in hue image.
Once the s-plane is extracted, it is thresholded to eliminate background and obtain possible WBC segment. After thresholding there are noise segments present which are removed by median filter. Now due to thresholding, nucleus of some of the WBC’s are segmented into two. So to reconnect them, we use dilation. And at last contour tracking is done in which area of the blood cell is compared with the standard blood cells and result is obtained. [6.2.1]
[Fig-16] .
Now after separation we plot a bar graph representing the values of mean, number of pixels, area, standard deviation and variance of each detected blob individually.
[Fig-19] , [Fig-20] , [Fig-21] .
This software is a very much application oriented. Different Blood cells have distinct features with respect to shape, size, granularity etc. It gives a very efficient and cost effective method for the blood cell counting instead of tedious manual methods and costly equipments.
[1] Kimbahune V.V. (2011) International journal of engineering science and technology.
» CrossRef » Google Scholar » PubMed » DOAJ » CAS » Scopus
[2] Mario Chirinos Colunga, Stephen J. Maybank (2009) Dept. of Computer Science and Information Systems, 5845, 545-555.
» CrossRef » Google Scholar » PubMed » DOAJ » CAS » Scopus
[3] Farnoosh Sadeghian (2009) Biological Procedures Online, 11(1).
» CrossRef » Google Scholar » PubMed » DOAJ » CAS » Scopus
[4] Scotti F. (2005) IEEE International Symposium CIMSA, 96-101.
» CrossRef » Google Scholar » PubMed » DOAJ » CAS » Scopus
[5] Sheikh H. and Bin Zhu (2002) IEEE Biomed Conference.
» CrossRef » Google Scholar » PubMed » DOAJ » CAS » Scopus
[6] De Silva C.R., Dept of Computer Science and Engineering, Sri Lanka.
» CrossRef » Google Scholar » PubMed » DOAJ » CAS » Scopus
[7] Gonzalez R.C. and Woods R.E. (2004) Digital Image Processing using Matlab, USA.
» CrossRef » Google Scholar » PubMed » DOAJ » CAS » Scopus
[8] Jain A.K. (1989) Fundamentals Of Digital Image Processing, Prentice Hall Englewoods cliffs, USA.
» CrossRef » Google Scholar » PubMed » DOAJ » CAS » Scopus
[9] William K. Pratt, Digital Image Processing. Third Edition. John Wiley & Sons Inc.
» CrossRef » Google Scholar » PubMed » DOAJ » CAS » Scopus
 | Fig. 1- Erythrocytes |
 | Fig. 2- Neutrophil |
 | Fig. 3- Eosinophil |
 | Fig. 4- Basophil |
 | Fig. 5- Lymphocyte |
 | Fig. 6- Monocyte |
 | Fig. 7- Manual Counting |
 | Fig. 8- Automatic counting |
 | Fig. 9- Standard Count |
 | Fig. 10- HSV Image |
 | Fig. 11- Sharpened Image |
 | Fig. 12- Filtered Image |
 | Fig. 13- Dilated Image |
 | Fig. 14- Labelled Image |
 | Fig. 15- Differential Count |
 | Fig. 16- RBC Count |
 | Fig. 17- WBC Count |
 | Fig. 18- Bar Graph Representing Statistical Values of Blob |
 | Fig 19- Statistical plot of WBC constituents |
 | Fig. 20- Statistical plot of WBC constituents |
 | Fig. 21- Statistical plot of WBC constituents |